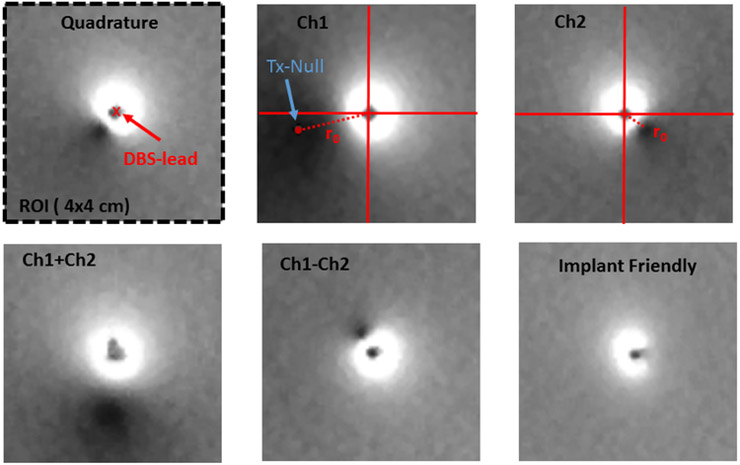
Figure 6.
calculated from the temperature data shown in Figure 5 is plotted with respect to induced RF current calculated from the B1+null locations in Figure 3. Matlab’s “fitlm” routine was used to fit the best line to the data resulting in an RMS error of 1.74 for contact 1 and 1.28 for contact 8. A linear pattern is observed between the two quantities. Note thatCh1+Ch2 and Ch1-Ch2 used twice as much transmitted power in comparison to other excitation patterns.

