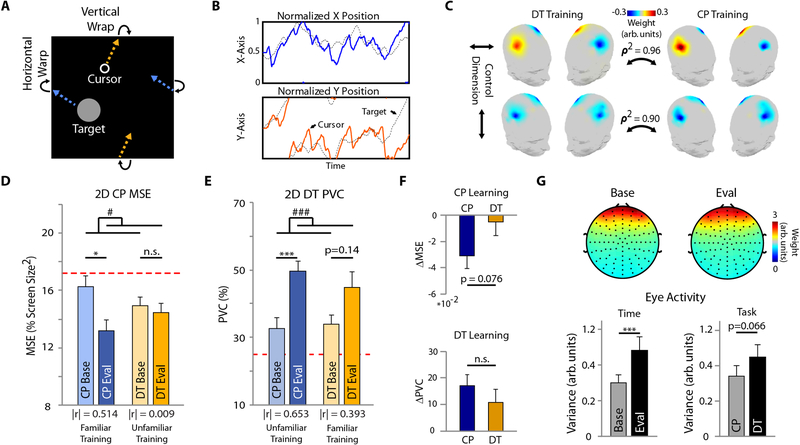
Figure 2. BCI Performance and User Engagement.
(A) Depiction of the CP edge wrapping feature. (B) Tracking trajectory during an example 2D CP trial. (C) Training feature maps for the DT and CP training groups for horizontal (top) and vertical (bottom) cursor control. ρ 2 – squared correlation coefficient. D-E: 2D BCI performance for the CP (D) and DT (E) task at baseline and evaluation for the CP and DT training groups. The red dotted line indicates chance level. The effect size, |r|, is indicated under each pairs of bars. (F) Task learning for the CP (top) and DT (bottom) tasks. (G) Eye blink EEG component scalp topography (top) and activity (bottom left) at baseline and evaluation, and activity during each task (CP vs. DT) (bottom right). Bars indicate mean + standard error of the mean (SEM). Statistical analysis using a one- (F) or two-way repeated measures (D-E, G) ANOVA (n=11 per group) with main effects of task, and time and task, respectively. Main effect of time: # p < 0.05, ### p < 0.005. Tukey’s HSD post hoc: * p < 0.05, *** p < 0.005.

