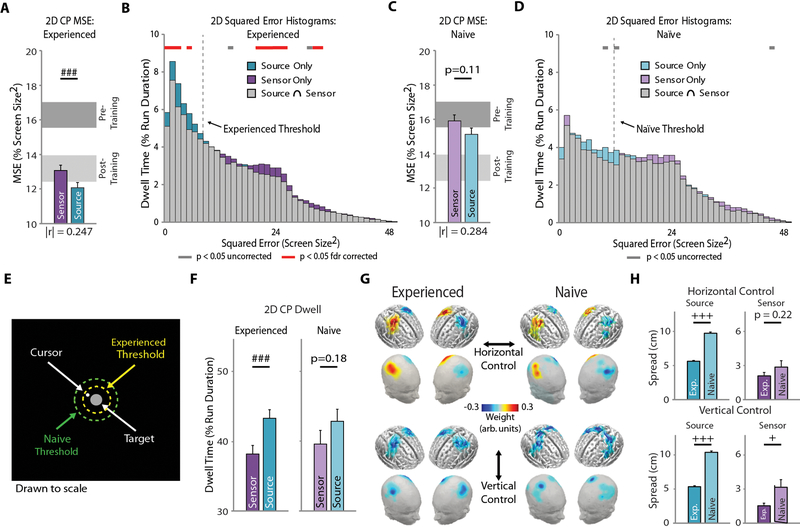
Figure 5. Online 2D CP Source vs. Sensor BCI Performance.
A-B Experienced user performance (n=16). (A) Group-level MSE for source and sensor 2D CP cursor control. Light and dark gray blocks represent performance for the CP training group (n=11, Fig. 2d) before (naïve) and after training (experienced). The effect size, |r|, is indicated under the pair of bars. (B) Group-level squared-error histograms for 2D CP sensor and source cursor control. C-D: Naïve user performance (n=13). Same as A-B for naïve user data. (E) Scale drawing of the continuous pursuit paradigm workspace displaying the spatial threshold derived from for experienced (yellow) naïve (green) user data (Fig. S6). (F) Cursor dwell time within the spatial threshold for experienced (left) and naïve (right) users. (G) Group-level feature maps for horizontal (top) and vertical (bottom) cursor control for naïve (left) and experienced (right) users. User-specific features were projected onto a template brain for group averaging. (H) Feature spread analysis between experienced and naïve users for source (left) and sensor (right) features for horizontal (top) and vertical (bottom) control. Bars indicate mean + SEM. Statistical analysis using a one- (C-D) or two-way repeated measures (A-B) ANOVA with main effects of decoding domain, and time and decoding domain, respectively. Main effect of decoding domain: ### p < 0.005 (A, C, F), gray bar p < 0.05 uncorrected, red bar p < 0.05 false discovery rate corrected (B, D). Mann-Whitney U test with Bonferroni correction for multiple comparisons (H): + p < 0.05, +++ p < 0.005.

