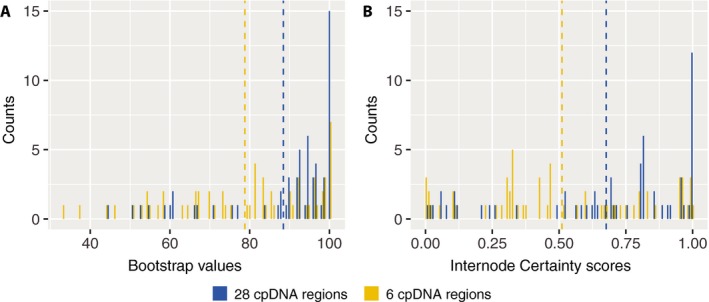
Figure 2.

Overall performance of chloroplast primers for phylogenetic studies in Thalictrum. (A) Bootstrap value distribution of the 28‐region (blue) and six‐region (yellow) phylogenies. Dashed lines represent mean values. (B) Internode certainty scores distribution of the 28‐region (blue) and six‐region (yellow) phylogenies. Dashed lines represent median scores.
