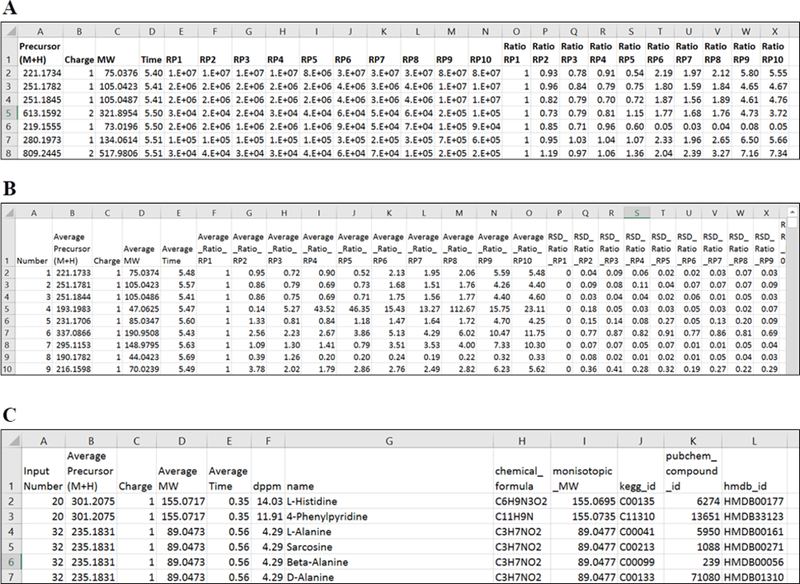
Figure 4.

Screenshots of the example result tables. Three demo files provided in Metandem interface were used as input files. A is the quantification result of individual file consisting of precursor ion information and reporter ion intensities and ratios. B is the merge table. For each merged feature, average reporter ion ratios and relative standard deviations (RSD) of ratios are calculated across all input data files, followed by the original reporter ion intensities and ratios from each data file. C is the metabolite identification table with ID numbers from KEGG, PubChem and HMDB databases. Average MW is the average monoisotopic MW across all input files. Note that accurate mass matching can generate multiple IDs from the same mass feature, which requires further examination and confirmation of metabolite identities by labeling metabolite standard compounds.
