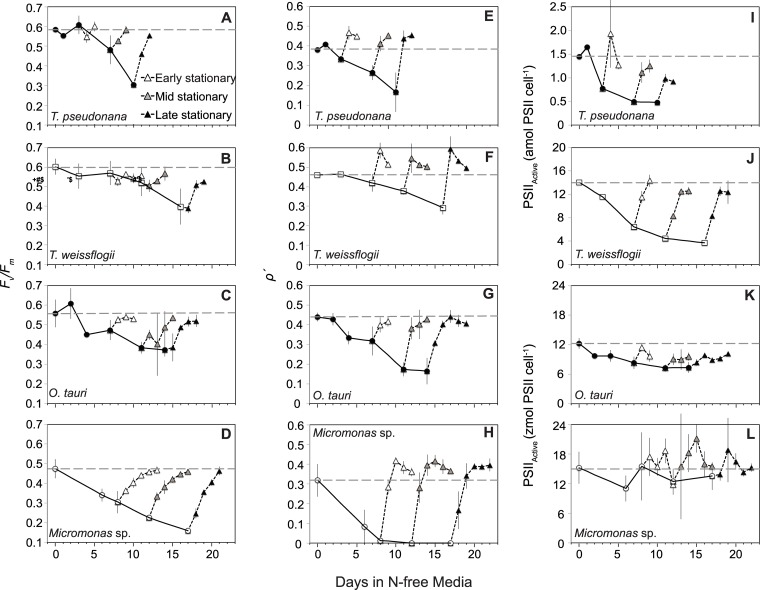
Fig 2. Changes in (A,B,C,D) the maximum quantum yield of the pool of PSII reaction centers (Fv/Fm), (E,F,G,H) the excitonic connectivity among PSII reaction centers (ρ′), and (I,J,K,L) active PSII reaction center (PSIIActive) content with N starvation and following the resupply of N.
Symbols are the same as in Fig 1. The values shown for ρ′ at each sampling point were determined under low actinic light (8 and 21 μmol photons m-2 s-1 for prasinophytes and diatoms respectively) as explained in the text. Error bars represent propagated standard error based on the calculated error of curve fitting by the FRRf software and the standard error among triplicate cultures.

