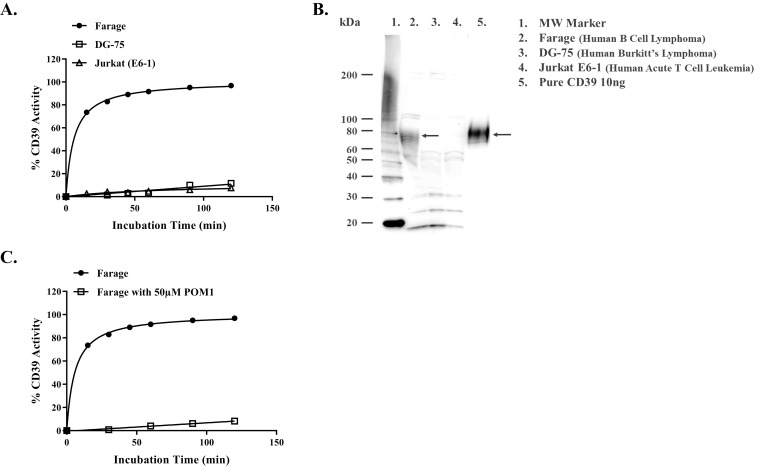
Fig 9. Determination of membrane bound CD39 enzyme activity and CD39 inhibitor potency on membrane associated CD39 activity.
(A) Determination of CD39 activity in cell membranes using three different cell lines, Farage cell (solid circle) has the highest CD39 activity using ATP as substrate. However, DG-75 (square) and Jurkat-E6-1 (triangle) show low or no CD39 activity. Reactions contained 200k cells per ml with 5μM ATP as substrate. (B) Typical western blotting results of CD39 abundance in membranes of the three cell lines tested in (A). Cell membrane from each cell (20μg per sample) and pure CD39 (10ng) as positive control were used and anti-CD39 antibodies. The experiment of CD39 activity was done in triplicates; results shown are mean ± SD. (c) Monitoring CD39 activity using Farage cells with (square) and without (solid circle) 50μM POM 1. Reactions contained 200K cell per ml of Farage cells per sample and incubated with 5μM ATP at 37°C with constant shaking at 100rpm. Aliquots of 30μl were withdrawn from each sample at certain time followed by the addition of equal volume of Kinase-Glo® One Solution to monitoring ATP consumption by Farage cells. Each point represents average of a typical experiment done in triplicates; results shown are mean ± SD.

