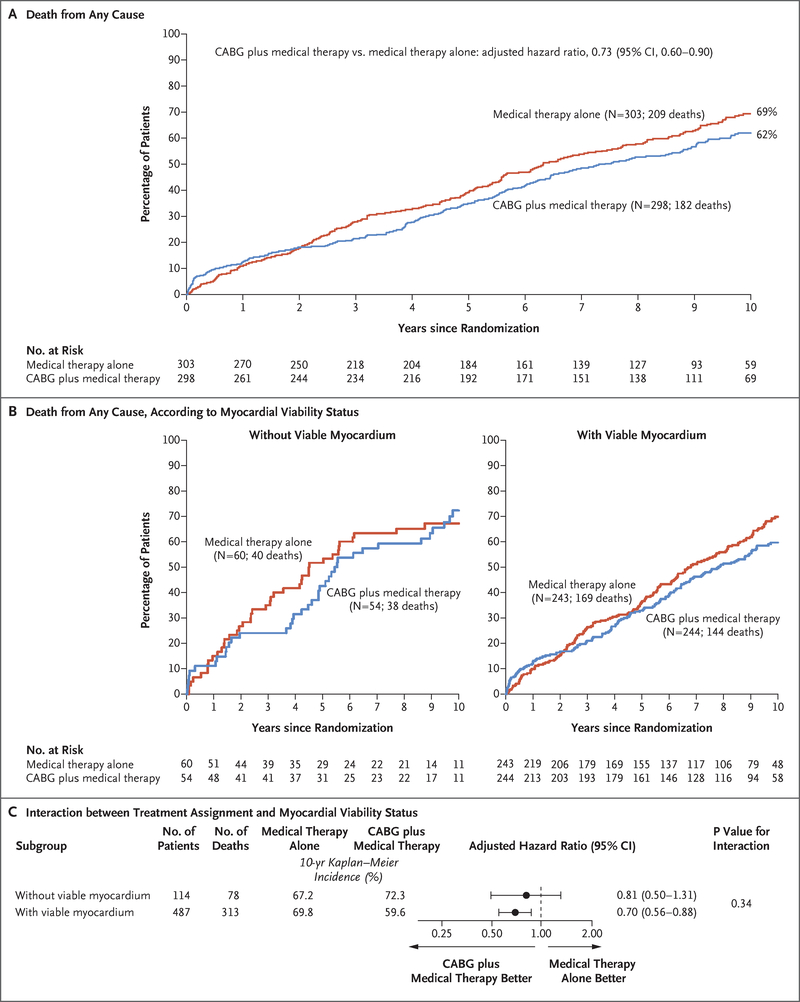
Figure 1 (facing page). Kaplan–Meier Analysis of the Incidence of Death from Any Cause.
Panel A shows Kaplan-Meier curves for the incidence of death from any cause among patients who underwent a myocardial viability test, according to treatment group; results were compared with the use of a Cox proportional-hazards model with adjustment for baseline covariates. Panel B shows Kaplan–Meier curves for the incidence of death from any cause among patients without viable myocardium (left panel) and among those with viable myocardium (right panel), according to treatment group. Panel C shows the results of a Cox proportional-hazards model that tested for the interaction between myocardial viability and treatment, with adjustment for baseline covariates. CABG denotes coronary-artery bypass grafting.

