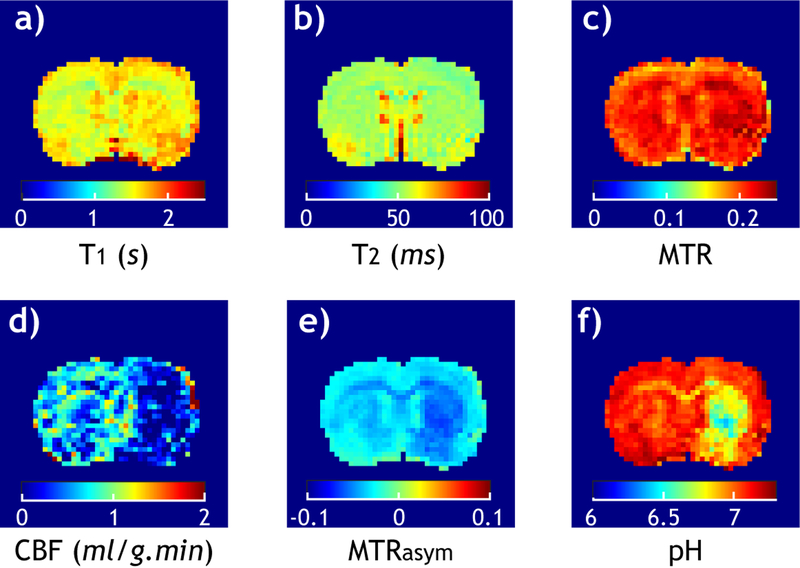
Fig. 1.
Multiparametric images of a representative acute embolic MCAO rat. a) T1 map. b) T2 map. c) MMTR image. d) CBF map. e) pH-sensitive MTRasym image. f) Tissue pH map. Although relaxation and MT images show little signal change in the ipsilateral ischemic lesion, both perfusion and pH images reveal severe ischemia, evidencing acute MCAO.

