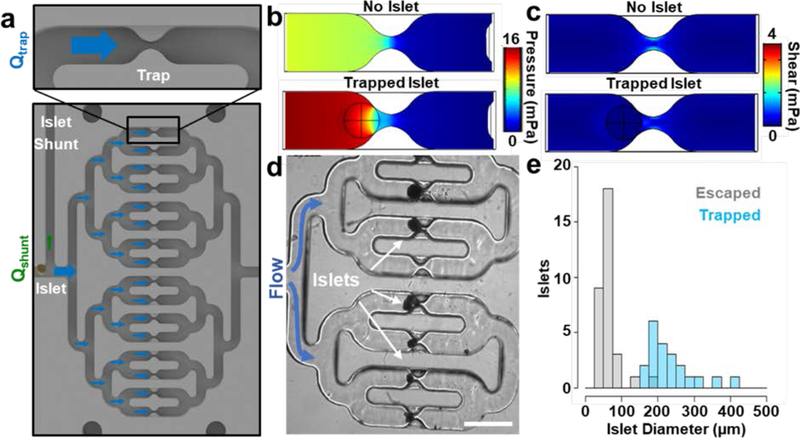
Figure 4 |. Hydrodynamic islet trapping in the Islet on a Chip.
a. Zoomed views of an islet trap (top) and the entire trap region (bottom) from the drawing of the chip in Figure 1b. Blue and green arrows indicate the direction and magnitude of flow through the trap regions (Qtrap) and islet shunt (Qshunt), respectively. As islets settle into each trap, the portion of flow leading to the shunt increases. b. Horizontal cross section of a 3D model of pressure around a single trap either with (bottom) or without (top) a trapped islet. c. Horizontal cross section of a 3D model of shear around a single trap either with (bottom) or without (top) a trapped islet. In both c and d, the position of the trapped islet is indicated by the black circle and crosshair. d. A phase contrast micrograph of trapped human islets on the chip. Scale bar denotes 1 mm. e. A histogram showing the number of islets (n = 53 islets from 3 separate experiments) of different sizes that either escaped (gray bins) or were trapped (blue, semitransparent bins) after entering an unoccupied trap. Bin size is 25 μm.

