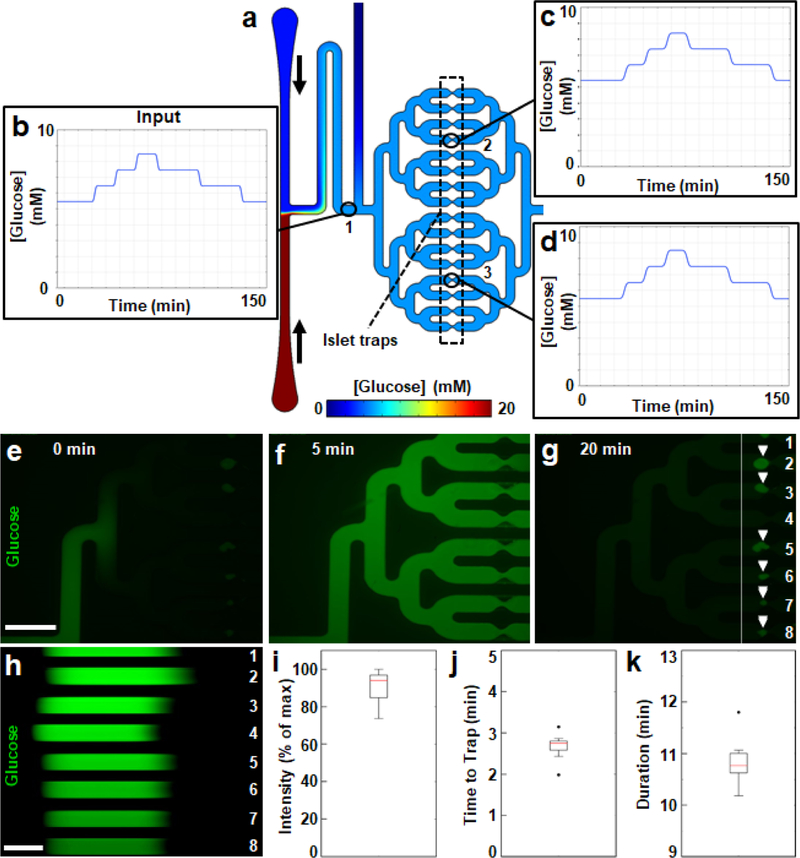
Figure 5 |. Parallel glucose delivery to isolated human islets in the chip.
a. Two-dimensional, time-dependent simulation of glucose diffusion through the trap region of the chip at an equilibrated glucose concentration of 5 mM. Simulated low (2.8 mM) and high (20 mM) glucose solutions entered the chip from the top and bottom inlets, respectively, with vertical black arrows to the right inlets indicating the direction of flow. The traps are indicated by a box with a dashed black outline and numbered black circles mark three points of interest in panels b-d. b-d. Plots of glucose pulses that were delivered to the chip in the simulation. Data points in each plot reflect the concentrations of glucose in the chip at points either immediately past the glucose mixing region (b, point “ 1”), or at traps in the top (c, point “2”) or bottom (d, point “3”) branches. e-g. Fluorescent micrographs from Movie S1 of the start (e, time = 0 minutes), middle (f, time = 5 minutes), and end (g, time = 20 minutes) of a ten-minute pulse of fluorescent glucose (green) traversing the trap region of the chip. Scale bar denotes 1 mm. White arrowheads in panel g indicate the positions of trapped islets. The eight parallel channels shown are numbered in white and a vertical white line indicates a cross section of interest in panel h. h. Time-lapse (kymograph) of Movie S1 at the cross section of the imaged area indicated by the white vertical line in panel g. Scale bar denotes 3 minutes and time is portrayed from left to right. i-k. Boxplots of maximum intensity (i), onset (j), and duration (k) of fluorescent glucose pulses across the eight channels in panel h.

