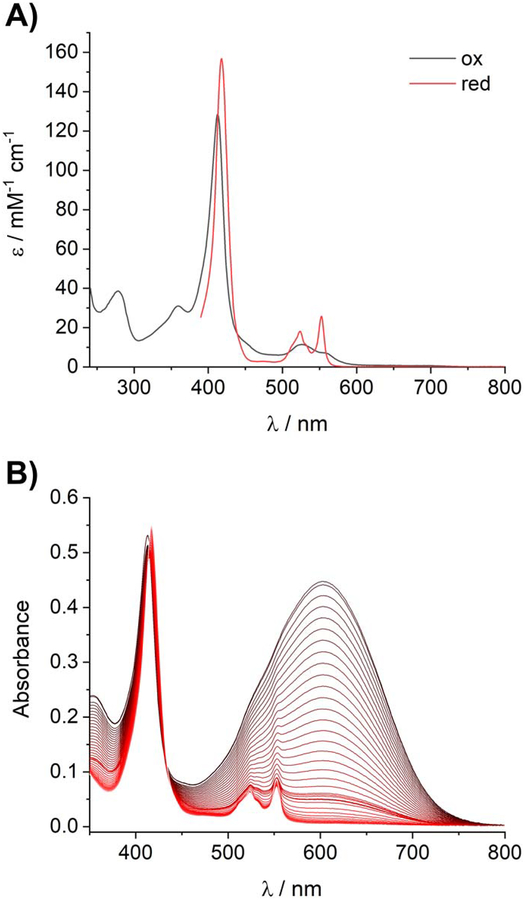
Figure 2.
Spectroscopic and redox characterization of XoxG. (A) UV-visible absorption spectra of oxidized XoxG and dithionite-reduced XoxG. (B) Spectrophotometric determination of the reduction potential of XoxG. A solution of oxidized XoxG and DCPIP was reduced by xanthine/xanthine oxidase over ~1 h (black to red lines: spectra acquired every 1 min, oxidized to reduced). Sharp features associated with reduced XoxG in the 520–560 range do not appear until late in the titration, showing that Em of XoxG is significantly lower than that of DCPIP. Data analysis is shown in Figure S6.

