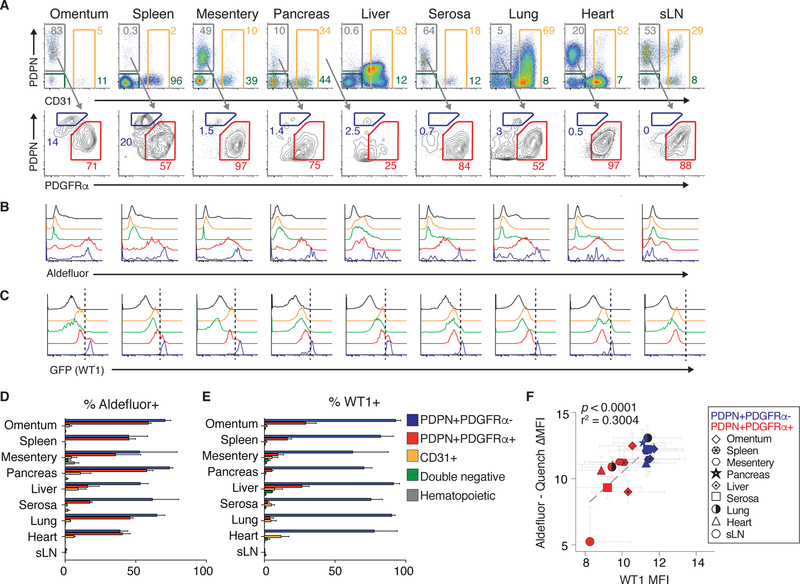
Figure 2.
Podoplanin (PDPN)+platelet-derived growth factor alpha (PDGFRα)- and PDPN+PDGFRα+ non-hematopoietic, -endothelial, -epithelial cells at cavity surfaces exhibit robust retinoid metabolism and express Wt1. (A) Representative gating for CD45-EpCAM-CD31-PDPN+PDGFRα- cells, CD45-EpCAM-CD31- PDPN+PDGFRα+ cells, CD45-EpCAM-PDPN-CD31+ endothelial cells and CD45- EpCAM-PDPN-CD31- double negative cells in cavity tissues and sLN. (B, C) Representative gating for aldefluor activity (B) and GFP (Wt1) (C). (D, E) Quantification of aldefluor positive (D) and GFP (Wt1) (E) positive cells across tissues. (B-E) in CD45-EpCAM-CD31-PDPN+PDGFRα- cells (blue), CD45- EpCAM-CD31-PDPN+PDGFRα+ cells (red), CD45-EpCAM-PDPN−/+CD31+ endothelial cells (orange) and CD45-EpCAM-PDPN-CD31- double negative cells (green) and SSClowCD45+ hematopoietic cells (black) in cavity tissues and sLN. (F) Relationship between aldefluor activity (Log2 transformation of aldefluor mean fluorescence intensity (MFI)) minus quench MFI) and WT1 MFI (Log2 transformation) across cavity tissues and sLN in CD45-EpCAM-CD31- PDPN+PDGFRα- cells (blue; PDPN+PDGFRα- in legend), CD45-EpCAM-CD31- PDPN+PDGFRα+ cells (red; PDPN+PDGFRα+ in legend). (A-F) Data are from three experiments with one mouse per experiment. Mean values + SEM are shown in histograms. (F) p value and r-squared values determined by linear regression.

