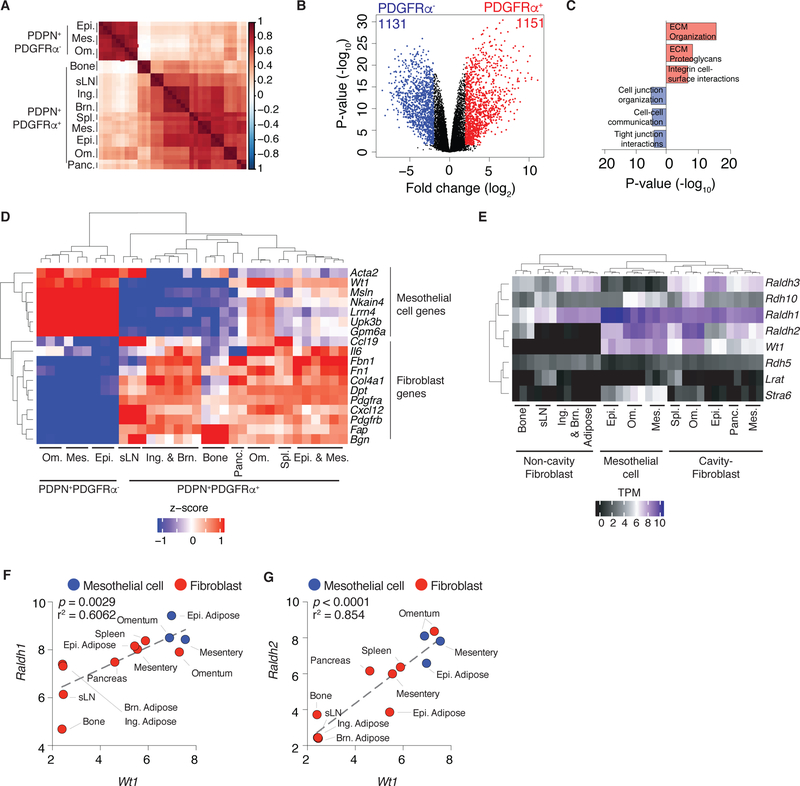
Figure 3.
Mesothelial cells and cavity-associated fibroblasts comprise Raldh½-expressing Wt1+ stroma. (A) Sample similarity heatmap showing spearman correlation between samples calculated from normalized, log transformed, mean-centered expression of top 2500 most variable transcripts. (B) Volcano plot depicting significantly different genes between omental, mesentery and epididymal adipose CD45-EpCAM-CD31-PDPN+PDGFRα- and CD45-EpCAM- CD31-PDPN+PDGFRα+ cells (FDR ≤ 0.05, Log2 FC ≥ 2). (C) Geneset enrichment of differentially expressed genes between CD45-EpCAM-CD31-PDPN+PDGFRα- cells (1131) and CD45-EpCAM-CD31-PDPN+PDGFRα+ cells (1151) evaluated using Reactome 2016. (D) Heatmap showing expression of a subset of differentially genes in comparison of CD45-EpCAM-CD31-PDPN+PDGFRα- cells and CD45-EpCAM-CD31-PDPN+PDGFRα+ cells that are hallmark mesothelial and fibroblastic genes. Significant genes were defined as FDR ≤ 0.05, Log2 FC ≥ 2. Wt1 was not differentially expressed but included in the heatmap. (E) Expression of genes associated with retinol metabolism in mesothelial cells and cavity and non-cavity fibroblasts. (F-G) Correlation between Raldh1 (F) and Raldh2 (G) and Wt1 in FACS-sorted mesothelial cells (blue) and fibroblasts (red). Gene expression across biological replicates (transcripts per million (TPM) + 5 (Log2)) were averaged to generate data points. (A, D-E) Ing. = inguinal, Brn. = brown, Om. = omentum, Epi. = epididymal, Mes. = mesentery, Panc. = pancreas, Spl. = spleen, sLN = skin draining lymph node. (A-G) Three independent biological replicates were sequenced for each cell type, aside from spleen and pancreas (n=2). (F, G) p value and r-squared values determined by linear regression.

