Figure 1.

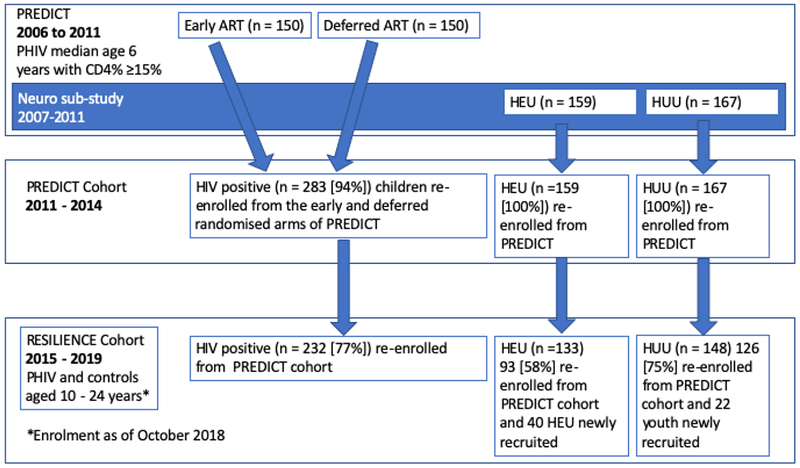
PREDICT, PREDICT Cohort, and RESILIENCE Study flow diagram. ART, antiretroviral therapy. Percentages in square brackets represent the percent of original PREDICT participants subsequently re-enrolled into PREDICT and RESILIENCE Cohorts.

PREDICT, PREDICT Cohort, and RESILIENCE Study flow diagram. ART, antiretroviral therapy. Percentages in square brackets represent the percent of original PREDICT participants subsequently re-enrolled into PREDICT and RESILIENCE Cohorts.