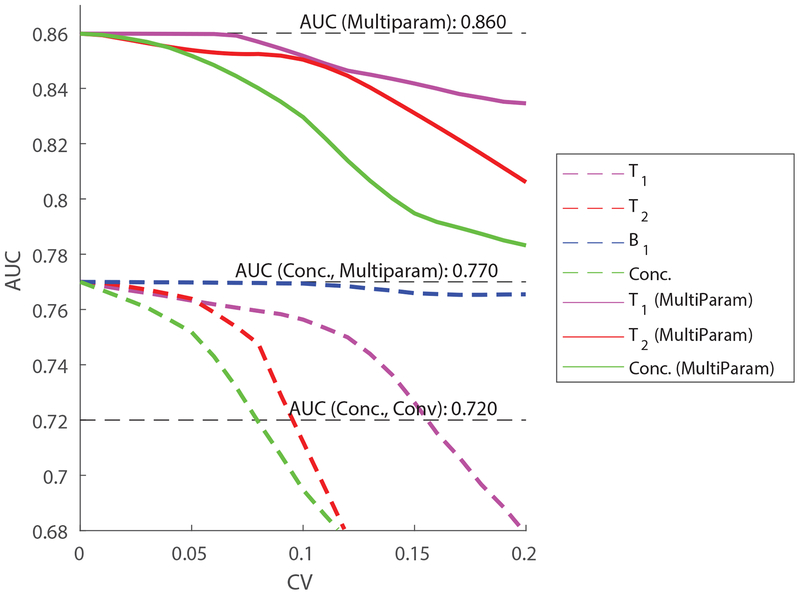
Fig. 2.
The effect of precision (intra-subject variability) on multiparametric MRS. The AUC is plotted as a function of the multiparametric MRS’s method coefficient of variation (CV) for each of the variables: T1, T2 and B1+, for both cases (C2) (using only the concentrations corrected using per-subject metabolite concentrations) and (C3) (using a full multiparametric classifier). Dashed lines correspond to (C2) while solid lines correspond to (C3). Note that, for multiparametric classification, only errors in the concentrations and relaxation parameters (but not B1+) are modeled.

