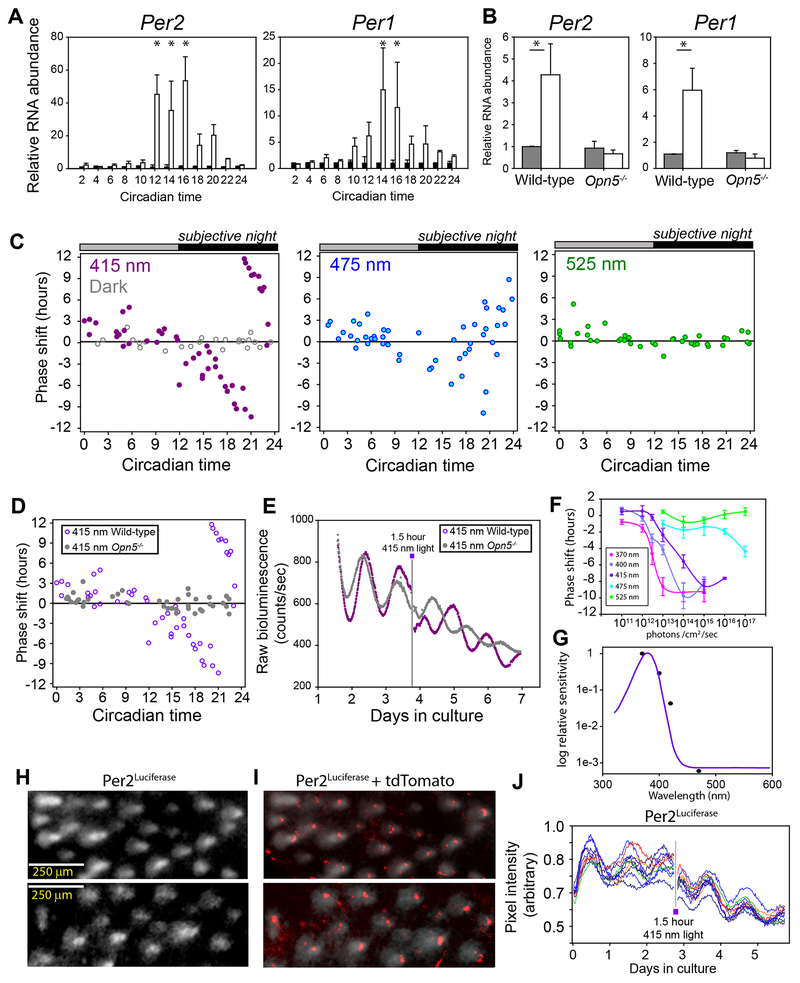
Figure 3. Induction of Per genes and phase shifts from acute light exposure.
(A) Relative RNA transcript from outer ear as measured by qPCR from wild-type organotypic tissue cultures. Tissues were cultured for 2 days and then given a 90 minute 5 W/m2 violet light pulse beginning at the phase shown (white bars) or left in darkness (dark bars). All transcripts are shown relative to β -actin and relative to their own dark control (dark bars) using ΔΔCt RT-PCR. All tissues were incubated in 10 μM 9-cis retinaldehyde. (B) Per2 and Per1 induction in pinna skin of wild-type or Opn5−/− mice receiving a light pulse in vivo. Mice were entrained to an LD cycle and then placed in constant darkness for 2 days before receiving a 60 minute violet light pulse of 2W/m2 beginning at circadian time 13. A and B Two Way ANOVA p < 0.05. * = p < 0.05 in Tukey post-hoc analysis. CT2 n = 3, CT4 n = 3, CT6 n = 5, CT8 n = 5, CT10 n = 4, CT12 n = 4, CT14 n = 15, CT16 n = 4, CT18 n = 3, CT20 n = 3, CT22 n = 3, CT24 n = 3. In vivo, n=5 for dark groups, n = 7 for light groups. (C) Phase response curves of cultured Per2Luc mouse pinnae receiving 90 minute, 2 x 10¹⁴ photons cm−2 s−1, light pulses of 415 nm, 475 nm, or 525 nm. Handling controls performed in darkness shown as gray circles. Pulse times are shown as the beginning of the pulse in which circadian time 12 corresponds to the peak of Per2Luc luminescence. (D) Phase response curve comparing wild-type (violet, same data as C, left) and Opn5−/− (gray) cultured pinnae. (E) Raw Per2luc luminescence traces of wild-type (violet) or Opn5−/− (gray) pinnae receiving a 90 minute 415-nm light pulse on the third day where indicated. (F) Phase delays ellicted by a 90 minute light pulse of the indicated photic flux and wavelength. Points and error bars represent mean ± SEM. (G) Action spectrum of relative sensitivity of half maximum of data from F (black points) compared to mouse Opn5 absorbance spectrum (violet line) adapted from[16]. (H) Per2Luc bioluminescence from a cultured mouse pinna as viewed from the base of hair follicles. (I) tdTomato expression (red) from Opn5Cre/+;Ai14 ear tissue overlayed with bioluminescence of Per2Luc ear (white from H). (J) Quantification of individual bioluminescent hair follicles as in (H) imaged over 6 days. A 415 nm, 2 x 10¹⁴ photons cm−2 s−1 light pulse was given for 90 minutes on day 2.7 where noted. See also Video S1.

