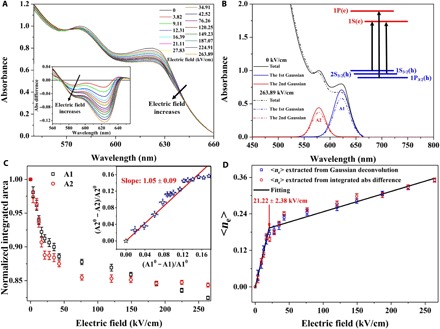
Fig. 3. Quantification of the charging level in CQDs.

(A) Visible absorbance spectra of CQDs under different electric fields. Inset: Absorbance spectra difference of the first excitonic features, which is defined as the CQD absorbance under electric field subtracted by the CQD absorbance under no electric field. (B) An example of deconvolution of the absorbance spectrum into the sum of four Gaussian fittings. Inset: The lowest three allowed interband transitions of CQDs. (C) Normalized integrated area of A1 and A2 as a function of electric field, suggesting the electron occupation of the 1S(e) state of the conduction band. Inset: Relationship between the relative bleach of the first and the second transitions. The solid line with the slope of ~1.05 is the linear fitting of the data (A10, A20 denote A1 and A2 under no electric field, respectively). (D) Average electron number per CQD, <ne>, with respect to electric field. The red circles are <ne> extracted from the absorbance bleach of the 1S(e)-1S3/2(h) transition via Gaussian deconvolution. The blue squares are <ne> calculated from the integrated absorbance difference, which is normalized by the maximum <ne> obtained by Gaussian deconvolution. The solid line shows the linear fitting to the data. The turning point (21.22 kV/cm) is consistent with the E-field threshold (20.13 kV/cm) defined in Fig. 2.
