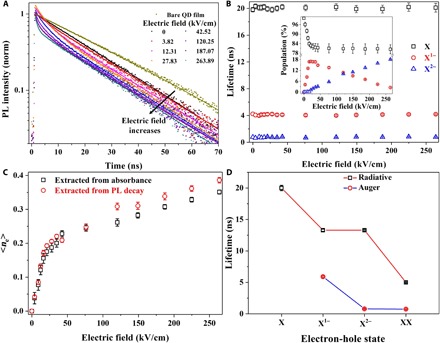
Fig. 4. Evolution of decay lifetime in CQDs with respect to the applied electric field.

(A) trPL decays with increasing electric fields. Dots are the experimental results, and solid lines are the fitting curves. The dark yellow decay curve is the result of bare CQD film on glass without electric field, while the black one is the decay of CQD film in the device structure without electric field. (B) Lifetimes as a function of the electric field extracted from the fitting of the decay curves with three exponential components. X, X1−, and X2− denote the neutral CQDs, singly charged CQDs, and doubly charged CQDs, respectively. Inset: Normalized population of X, X1−, and X2− as a function of the electric field. (C) Compare average charge per CQD, <ne>, extracted from absorption spectra and PL decays. The consistence here supports our previous explanations in Figs. 2 and 3. (D) Auger and radiative lifetimes of different electron-hole states. XX denotes the biexciton of neutral CQDs. The biexciton lifetime used here is cited from (33) for a similar CQD structure. In our device structure, Auger lifetime of the biexciton is quite close to Auger lifetime of the doubly charged trion (0.75 ns compared with 0.79 ns).
