Figure:
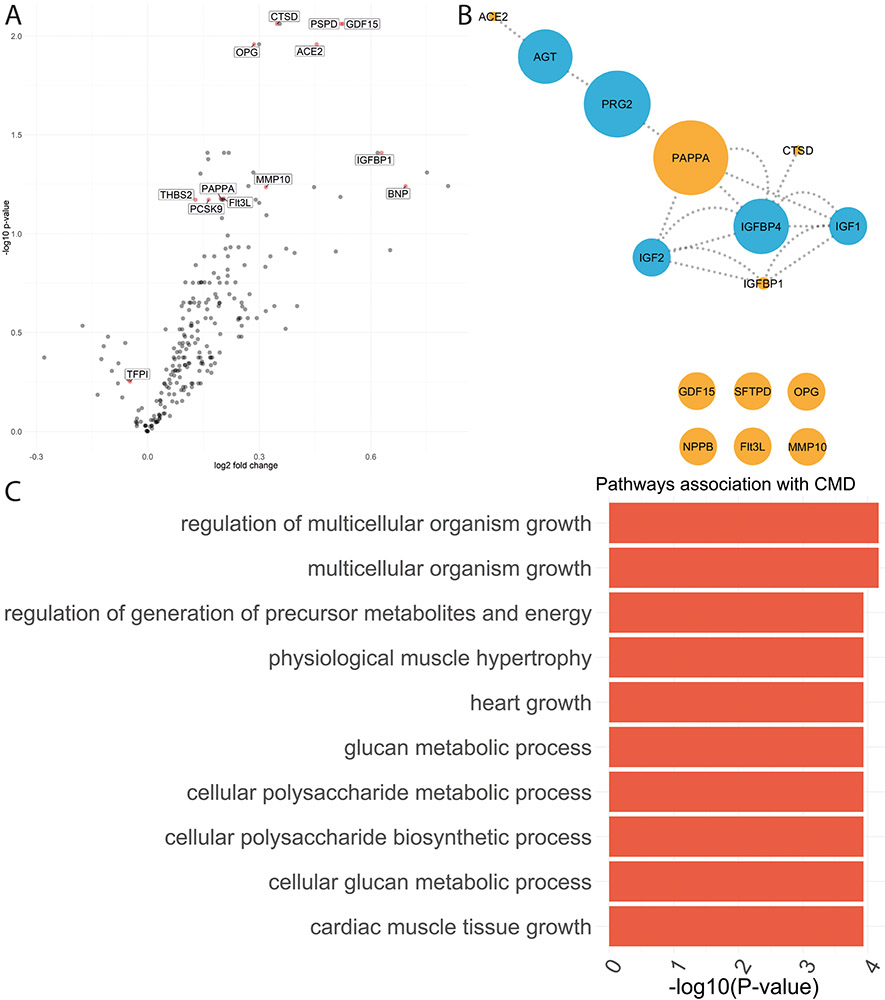
(A) Volcano plot showing biomarkers selected by LASSO penalized regression analyses (red). The Y-axis shows the -Log10 of the false discovery rate corrected p-value for the association of each individual biomarker with coronary microvascular dysfunction (coronary flow reserve <2.5) versus no coronary microvascular dysfunction. The X axis shows the log2 of the fold change of biomarker difference between patients with and without coronary microvascular dysfunction. (B) Results of network analysis for the biomarkers independently associated with coronary microvascular flow reserve (orange) and those predicted in the network (blue). The size of the node reflects the edge betweenness of each biomarker. (C) Bar graph depicting the top 10 overrepresented pathways with the -log10 of the false discovery rate corrected P-value on the X-axis

