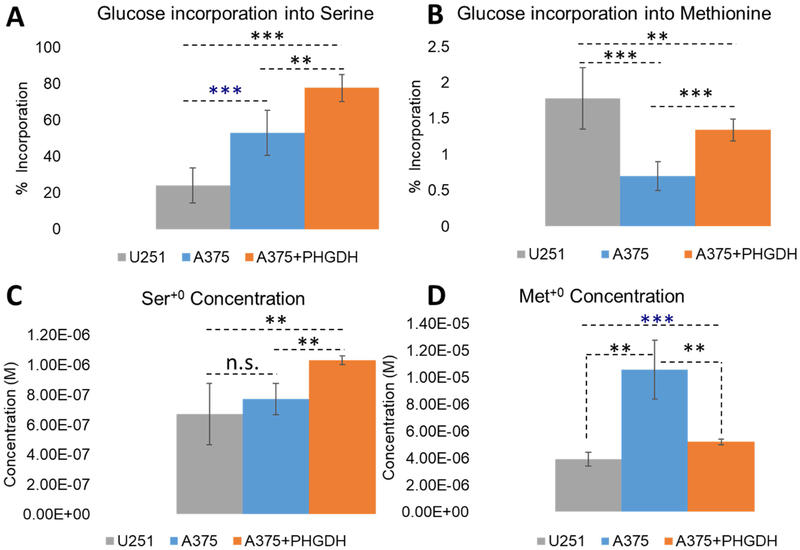
Figure 6. Measuring serine and methionine intracellular pools in three different cell lines and the fraction produced from de novo synthesis from glycolytic precursors.
P-values are reported as: * = p < 0.05, ** = p < 0.01, *** = p < 0.0001, relative to the control sample with no inhibitor. Otherwise the P-values were found to be not significant and are labeled n.s.

