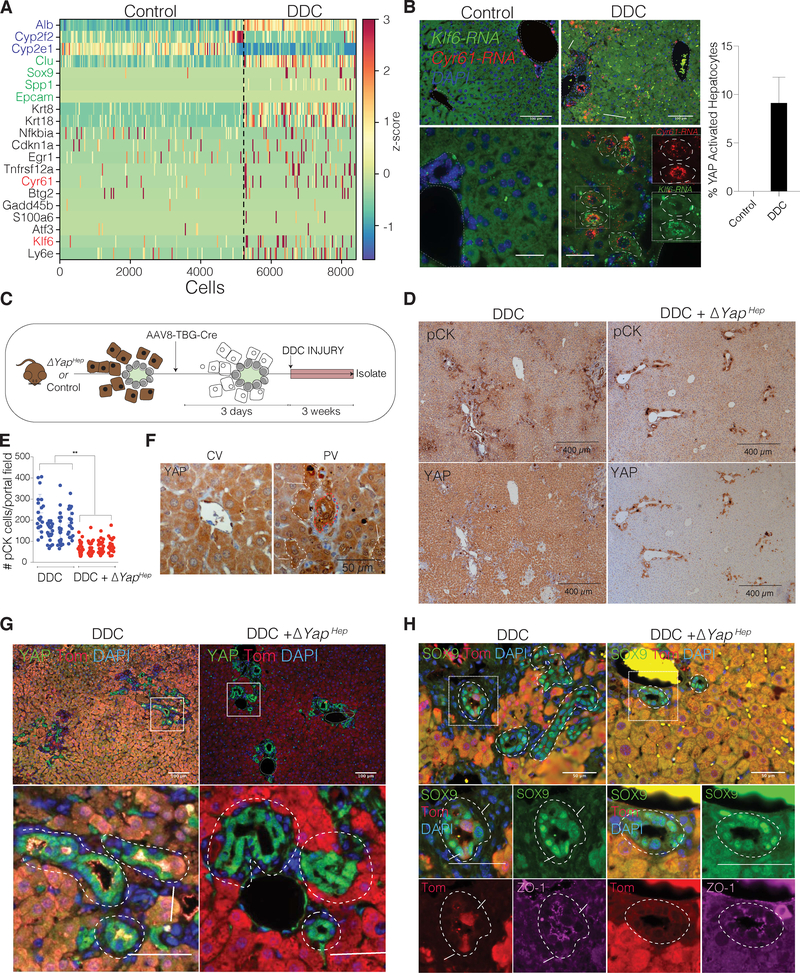
Figure 4. YAP Activity is Upregulated in a Subset of Hepatocytes and is Required for the Hepatocyte Regenerative Ductular Response to Injury.
(A) Heatmap of scRNA-seq analysis of hepatocytes isolated from mice either fed a regular (Control) or DDC diet for 1 week, each with cells ordered according to their predicted relative position from the central (left) to the portal vein (right), using landmark genes (exemplary Alb, Cyp2f2 and Cyp2e1 in blue). Colors denote relative expression for shown candidate genes (highlighted: biliary markers (green) YAP targets from BECs (black), RNA-ISH analyzed genes (red).
(B) RNA-ISH for Klf6 and Cyr61 in livers of mice fed with regular (Control) or DDC diet for 1 week (with magnified insets). Arrows and dashed lines represent YAP-active, periportal hepatocytes that co-express both Cyr61 and Klf6 RNA. Bar plot depicts mean ± SD of YAP-active hepatocytes.
(C) Schematic of study design for panels D-H.
(D) pCK and YAP immunostains of control and ΔYapHep mice.
(E) Quantification of pCK+ cells per portal field (20 per mouse analyzed, mean ± SD for each mouse (n = 4)).
(F) Representative high magnification images of YAP immunostain for portal and central vein areas highlighting clusters of YAPHigh hepatocytes (white dashed lines) exclusively periportal. Bile duct is outlined with red dashed line.
(G) IF for YAP/Tom of control and ΔYapHep DDC mice with magnifications. Presence of Tom+/KRT19+ cells (arrow) are only observed in the biliary structures (dashed lines) of control, DDC only, mice (n = 4 mice per group).
(H) IF for SOX9/Tom/ZO-1 of control and ΔYapHep DDC mice. Dashed lines outline biliary structures. Magnified insets show SOX9+ ducts with apical ZO-1 expression. Arrows indicate SOX9+/Tom+ cells within the duct, exclusively in DDC control mice.
See also Figure S3.

