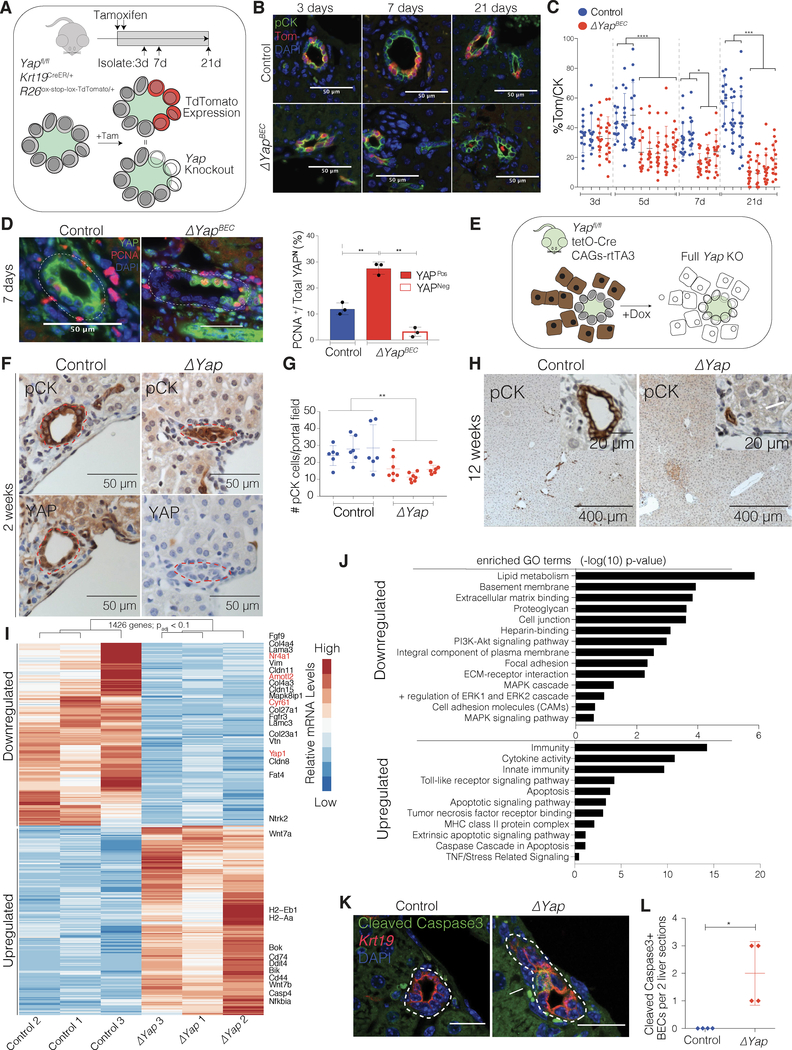
Figure 5. YAP is Required for the Maintenance of Adult Homeostatic BECs.
(A) Schematic illustrating experimental design for TAM-inducible biliary-specific Yap KO (ΔYapBEC) and control mice and expected correlation of Tom labeling with Yap KO.
(B) IF for pCK/Tom in ΔYapBEC and control mice at indicated time points after TAM.
(C) Scatter plot of the % of pCK+ BECs that are Tom+ at indicated time points after TAM, showing Tom+ cell loss in ΔYapBEC mice over time (Mean ± SD for 15 portal fields per mouse).
(D) Left: PCNA and YAP IF on ΔYapBEC and Control mice 7 days after TAM. Right: % of PCNA+ BECs stratified according to YAP-positivity, indicating that KO escaper BECs are actively proliferating (Mean ± SD for 20 portal fields for 3 mice per group, ANOVA, followed by Tukey multiple comparisons test).
(E) Schematic illustrating pan-inducible KO of Yap (ΔYap mice).
(F) Representative serial immunostains of pCK and YAP for ΔYap and Control mice 2 weeks after starting Dox, showing efficient Yap KO and disintegration of ductal structure in ΔYap mice.
(G) Scatter plot of the number of pCK cells per portal field in ΔYap and Control mice (Mean ± SD for 6 portal fields per mouse).
(H) Immunostains for pCK of ΔYap and Control 12 weeks after starting Dox. Arrowhead indicates area of intraparenchymal necrosis. Insets depict bile duct at high magnification with arrow indicating few remaining pCK+ cells in ΔYap mice.
(I) Heatmap of top 1426 significantly 1.5-fold up- and down-regulated genes (padj < 0.1) based on RNA-seq data from FACS-sorted ΔYap and Control BECs from mice (n = 3 per group) 2 weeks after start of Dox. YAP-associated genes are highlighted in red.
(J) GO terms of differentially-expressed genes from David Bioinformatics database. Bars indicate level of significance.
(K) IF for cleaved-Caspase 3 (cCasp3) from ΔYap and Control mice 2 weeks after start of Dox. Arrow points out positive signal only observed in ΔYap mice.
(L) Quantification of cCasp3+ cells within two histological sections per mouse. (Mean ± SD, n = 4 mice per group).
Dashed lines generally outline biliary structures.
See also Figures S4 and S5.

