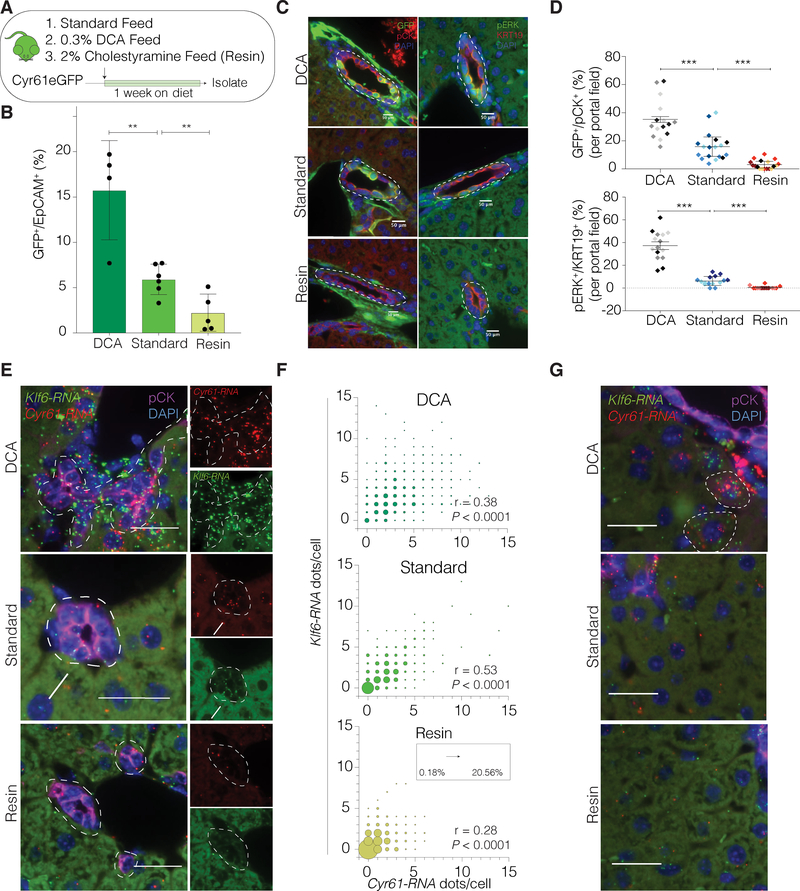
Figure 6. Homeostatic YAP Activity in BECs is Regulated by BAs.
(A) Schematic of the experimental design.
(B) Bar-scatter-plot of the % of GFP+ BECs from Cyr61eGFP mice on indicated diets by FACS-analysis. Each dot represents a mouse (n = 4–5 per group).
(C) IF for GFP/pCK and pERK/KRT19 in Cyr61eGFP mice fed with the indicated diets. Dashed lines outline bile ducts.
(D) Quantification of GFP+ (top) and pERK+ (bottom) BECs in IF, depicting significant differences between groups. Each color represents an individual mouse per group (5 portal fields per animal).
(E) Dual RNA-ISH for Cyr61 and Klf6 with concurrent IF for pCK on Cyr61eGFP mice administered the indicated diets. Arrow indicates exemplary Cyr61-Klf6 co-expressing BEC.
(F) Bubble plots for the quantification of co-localized Cyr61 and Klf6 RNA molecules per cell. Size of bubble corresponds to the co-expression frequency for Cyr61 and Klf6 within each condition and is indicated as % in the inset (n = 4 mice, BECs from 5 portal fields each, Spearman correlation).
(G) Visualization of the hepatic parenchyma using dual RNA-ISH for Cyr61 and Klf6 on mice administered the indicated diets. Dashed lines outline hepatocytes with co-expression in the DCA group.
See also Figure S6.

