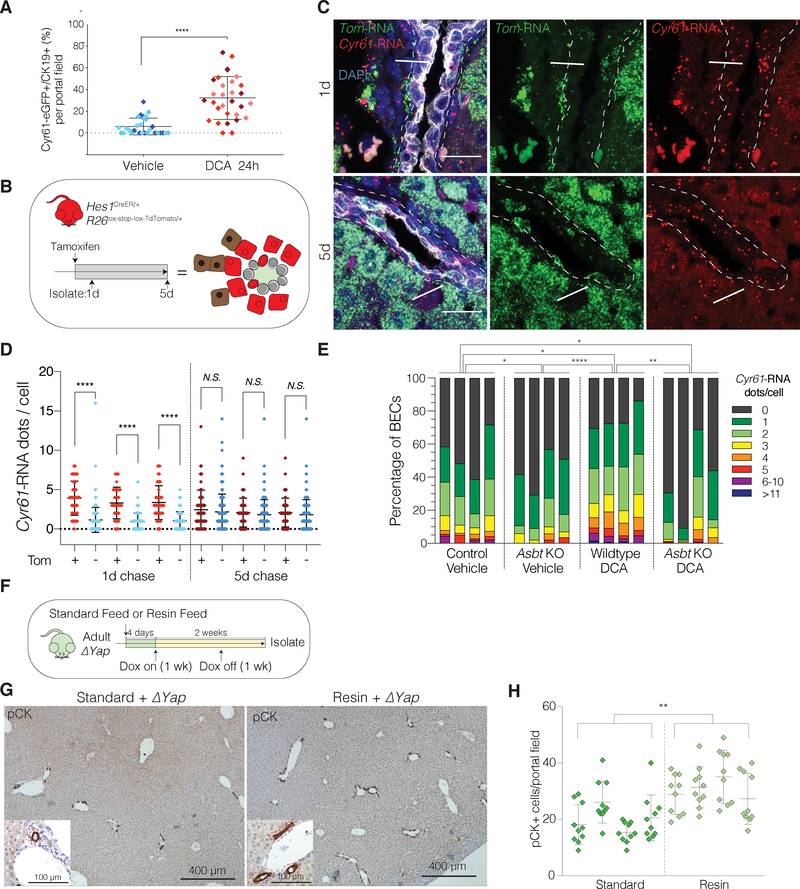
Figure 7. BA-Induced YAP Activity is ASBT-Dependent and Dynamically Fluctuates in BECs Under Physiological Conditions.
(A) Scatter plot of the % of GFP+ BECs per portal field in IF of Cyr61eGFP mouse livers 24h after i.p. treatment with vehicle or DCA. Each diamond represents a portal field with colors indicating an individual mouse (n = 3 per group).
(B) Schematic illustrating experimental design for TAM-inducible Tom labeling of Hes1-expressing cells with TomHes1 mice at 1d and 5d chase for panels C-D.
(C) Dual RNA-ISH for Cyr61 and TdTomato (Tom) with concurrent IF for KRT19 on TomHes1 mice, 1 and 5d after TAM. Arrows indicate Tom/Cyr61 co-expressing BECs (enriched in 1d group), arrowheads designate exclusively Tom expressing BECs.
(D) Quantification of Cyr61-RNA dots per BEC, stratified by Tom-positivity indicating a significant positive correlation only at 1d chase (n = 3 mice per group).
(E) Distribution bar plot of Cyr61-RNA ISH quantification for the indicated groups. Each bar represents a mouse. BECs are color-coded according to the number of Cyr61-RNA dots and shown as % of cumulative 10 portal fields counted. P-values were computed using the Kullback-Leibler test and indicate significant differences between each group.
(F) Experimental design.
(G) Low-magnification immunostains for pCK in ΔYap mice fed with indicated diets. Magnified insets depict portal tracts with bile ducts (red dashed lines).
(H) Quantification of pCK+ cells per portal field (Mean ± SD of 10 portal fields for the indicated mice (n = 4 per group)).
See also Figure S7.

