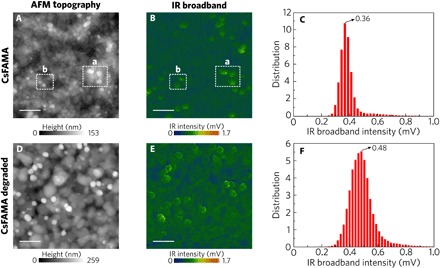
Fig. 2. Topography and IR broadband imaging of the perovskites.

Topography images (5 μm by 5 μm) of (A) CsFAMA and (D) CsFAMA degraded samples. The topography of the CsFAMA sample shows an even background layer with grains ranging from few to several hundreds of nanometers. The IR broadband image revealed an inhomogeneity in vibrational activity. Particles with stronger activity are associated with higher height observed in the region highlighted by the white dashed square a in (A) and (B), but nanoparticles with stronger activity not associated with higher height in the topography image as highlighted in square b are also observed. The induced degradation led to a growth of the grains, and the vibrational activity became more intense (E). From the IR broadband intensity histograms, there is a shift in the intensity from 0.36 mV in the CsFAMA sample (C) to 0.48 mV in the CsFAMA degraded sample (F). Scale bars, 1 μm.
