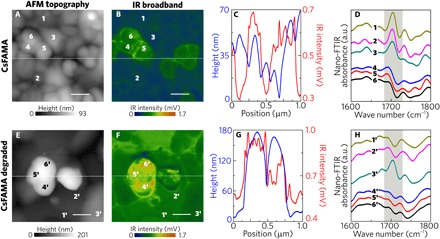
Fig. 4. Nanoscale chemical composition investigation by nano-FTIR.

(A and E) AFM topography map (1 μm by 1 μm) of pristine CsFAMA and degraded CsFAMA perovskites, respectively. (B and F) Respective IR broadband images revealing heterogeneity in vibrational activity. Topography and IR broadband response do not completely correlate, as shown by the profiles in (C) and (G) related to pristine and degraded CsFAMA, respectively. (D and H) Nano-FTIR point spectra from the regions marked by numbers in (A), (B), (E), and (F). The characteristic vibrational mode of FA shows up only in grains with a weaker IR broadband response. For the degraded CsFAMA (H), the FA vibrational mode is less pronounced. The location 3′ is one of the few where the FA mode can be seen outside isolated grains. Scale bars, 200 nm.
