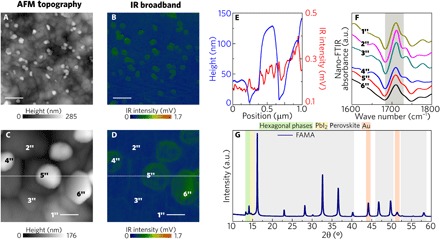
Fig. 6. Nanoscale chemical composition investigation by nano-FTIR of FAMA perovskite.

(A and B) AFM topography map (5 μm by 5 μm) of FAMA perovskite and IR broadband image, respectively (scale bars, 200 nm). (C and D) Respective 1 μm by 1 μm images revealing heterogeneity in vibrational activity similar to pristine CsFAMA perovskite (scale bars, 200 nm). (E) Profiles of the topography and IR broadband. (F) Nano-FTIR point spectra from the regions marked in (C) and (D) reveal the presence of vibrational mode of FA in all marked locations. (G) The XRD pattern reveals that the FAMA sample is composed mostly of cubic perovskite, hexagonal phases, and PbI2 in less quantity. The high-resolution XRD measurements were performed at 7 keV.
