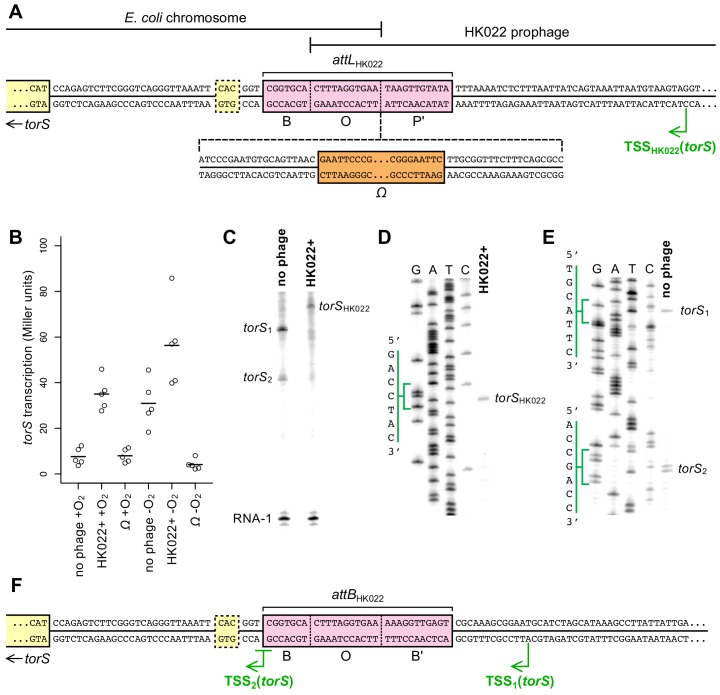
Figure 3. Transcription of torS in an HK022 lysogen originates from within the prophage.
(A) Sequence of the torS-adjacent HK022 integration site (attLHK022) in an HK022 lysogen. B, O, and P’ indicate the bacterial, overlap, and phage segments of the integration site, respectively (Campbell, 1992; Yagil et al., 1989). The location of the Ω element terminator insertion in strain JNC175 is indicated. In this strain, transcription reading toward torS from within the HK022 prophage is blocked by the Ω element. The transcription start site, TSSHK022, was mapped by in vitro transcription and primer extension, shown in (C) and (D). The previously inferred torS GTG start codon is outlined, and the experimentally confirmed ATG start codon is indicated as the start of the torS coding sequence. (B) Aerobic and anaerobic transcription of torS was measured by β-galactosidase assays in strains carrying a torS-lacZ operon fusion. Strains contained the wild-type HK022 prophage (JNC169), the prophage with an Ω element (JNC175), or had no prophage at the integration site (JNC166). Each circle represents a measurement obtained from an independent experiment, and the horizontal lines indicate average values. (C) In vitro transcription from plasmids containing sequence upstream of torS from the HK022 lysogen (‘HK022+’, pPK13256) or the non-lysogen (‘no phage’, pPK12669) shows that different transcripts are produced when the prophage is present or absent. Transcription using non-lysogen sequence produces two distinct transcripts, suggesting two transcription start sites for torS. RNA-1 is a control transcript for in vitro transcription and gel loading that is generated from a σ70-regulated promoter in pPK13256 or pPK12669. (D) Primer extension was performed to map the transcription start site of the in vitro ‘HK022+’ transcript shown in (C). The position of the start site is indicated in (A). (E) Primer extension was performed to map the transcription start sites of the in vitro ‘no phage’ transcripts shown in (C). The positions of the start sites are indicated in (F). (F) Sequence upstream of torS in a non-lysogen, with the torS transcription start sites depicted. Transcripts originating from TSS2 can begin at the underlined G or A position, as indicated by the adjacent bands in (E).


