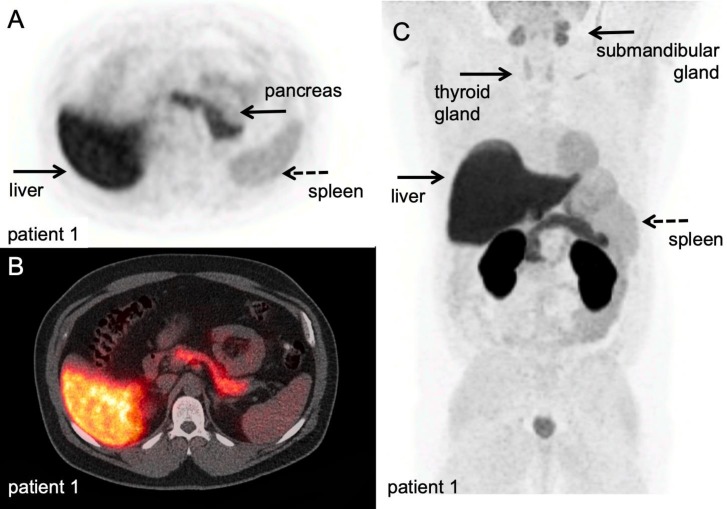
Figure 4.
[18F]F-AraG PET/CT scan. A volunteer scanned at 60 minutes after IV injection of 189,07 MBq. A-B: transversal PET and fused PET/CT images of a volunteer; physiological [18F]F-AraG distribution in vivo. [18F]F-AraG exhibits hepatobiliary and renal clearance with highest uptake in associated organs at 60 minutes after IV tracer injection. C: Maximum intensity projection; relatively high uptake was observed in the myocardium, as seen in mice, and to lesser extend in the pancreas and spleen. Low background was observed in the thorax and lower abdomen. With courtesy of CellSight Technologies Inc.

