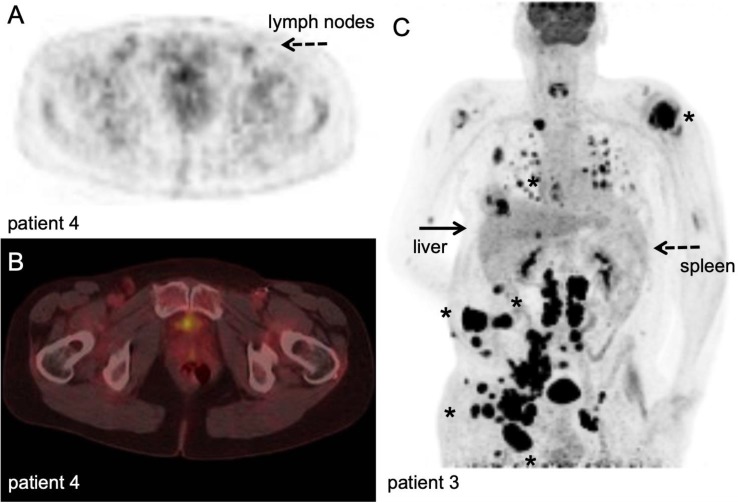
Figure 6.
[18F]FDG PET/CT example. Stage III melanoma patient during adjuvant immune therapy, scanned at 60 minutes after IV injection of 207 MBq. A-B: transversal PET and fused PET/CT images; upon intranodal injection with antigen loaded dendritic cells, a faint signal increase in the injected and subsequent draining lymph nodes in the right inguinal region (dashed arrow) was observed which was not correlated to the magnitude of antigen specific T-cell responses. (78, unpublished results). C: Maximum intensity projection; in vivo biodistribution of [18F]FDG in the same stage IV metastatic melanoma patient as Figure 4 with multiple lesions in lymph nodes, subcutaneous tissue and lung (asterisk). Note the normal physiological activity as well as high uptake in the metastatic tumour lesions. With courtesy of B. van der Hiel.

