
Figure 3: Enteroid actin cytoskeleton.
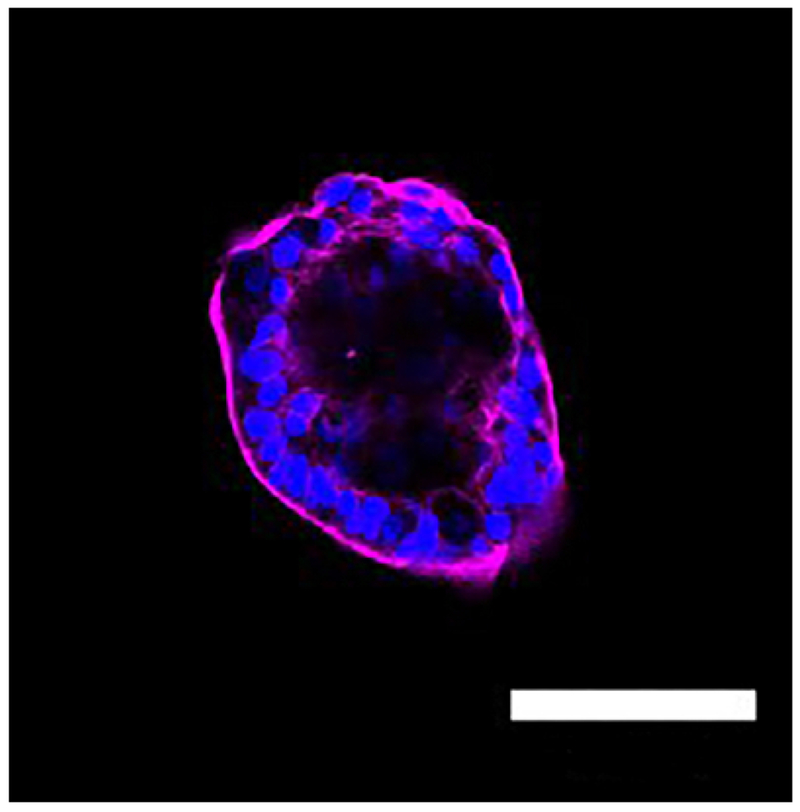
Immunoflorescence micrograph of an enteroids. The enteroid displays structural integrity as demonstrated by the prominent actin cystoskeleton (magenta). Nuclei stained with DAPI (blue), Scale bar = 100 μm.
Official websites use .gov
A
.gov website belongs to an official
government organization in the United States.
Secure .gov websites use HTTPS
A lock (
) or https:// means you've safely
connected to the .gov website. Share sensitive
information only on official, secure websites.
Immunoflorescence micrograph of an enteroids. The enteroid displays structural integrity as demonstrated by the prominent actin cystoskeleton (magenta). Nuclei stained with DAPI (blue), Scale bar = 100 μm.