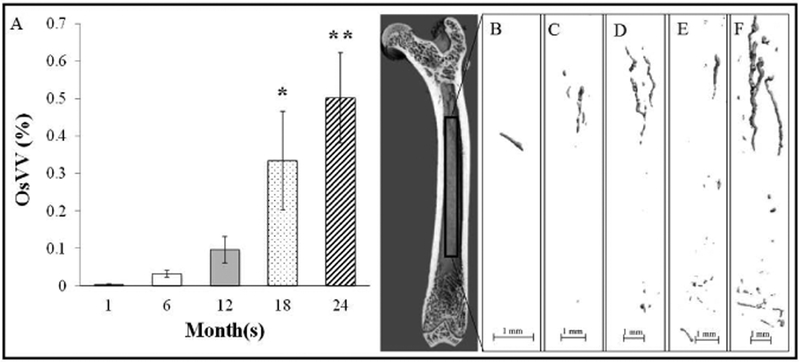
Figure 2.
A) Ossified vessel volume across the lifespan. B), C), D), E), and F) Representative MicroCT images of ossified bone marrow blood vessels at 1-month, 6-months, 12-months, 18-months and 24- months, respectively. Values represent Means ± S.E. *p<0.05 vs. 1-month and 6-months; **p<0.05 vs. 1- month, 6-months and 12-months. 1-month, n=9; 6-months, n=9; 12-months, n=10; 18-months, n=9; 24- months, n=11.

