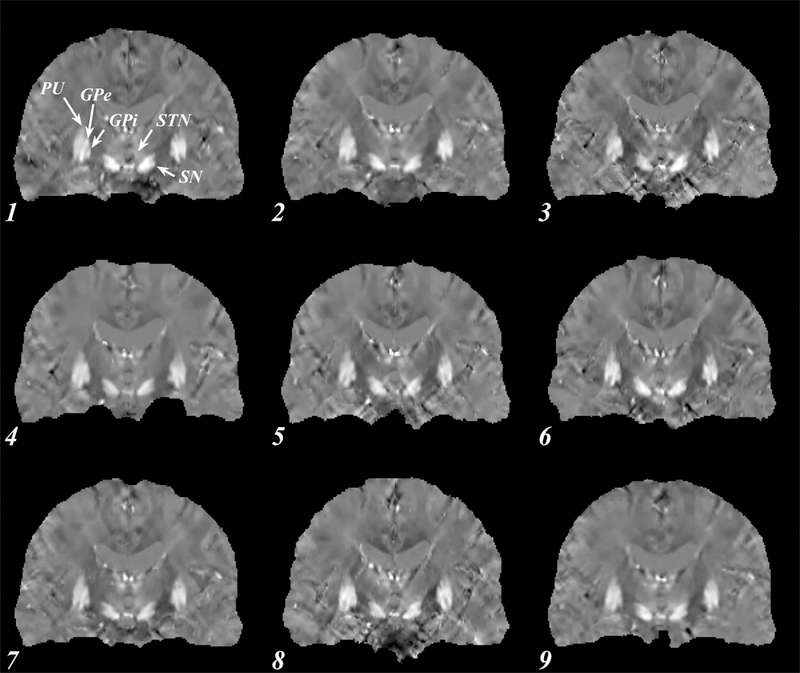
Figure 2.

Coronal susceptibility map for a single subject using the high resolution protocol. Numbers indicate site (see Table 1). All images shown are co-registered, clearly depicting the subthalamic nuclei (STN) and the globus pallidus (GP), important targets for deep brain stimulation. Other brain regions well visualized are the putamen (PU), external and internal globus pallidus (GPe and GPi) and the substantia nigra (SN).
