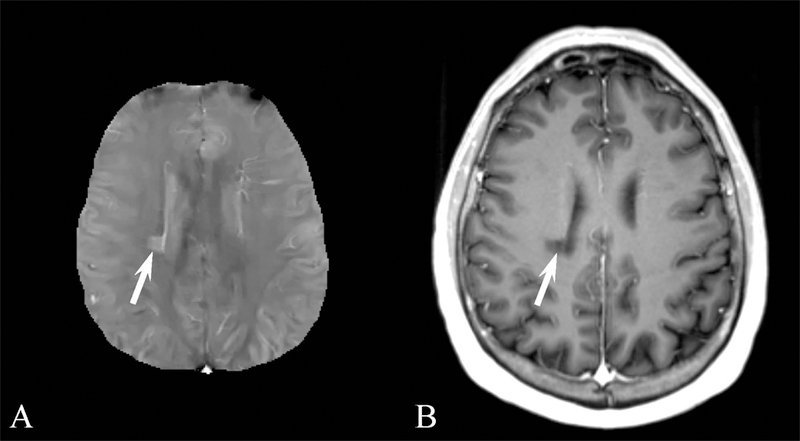
Figure 7.

A) Brain quantitative susceptibility map (QSM) of a 46 year old male with multiple sclerosis (MS). The MS lesion indicated by the arrow in the right corona radiata is hyperintense on QSM. (B) The lesion is nonenhancing the contrast enhanced longitudinal relaxation (T1) weighted image.
