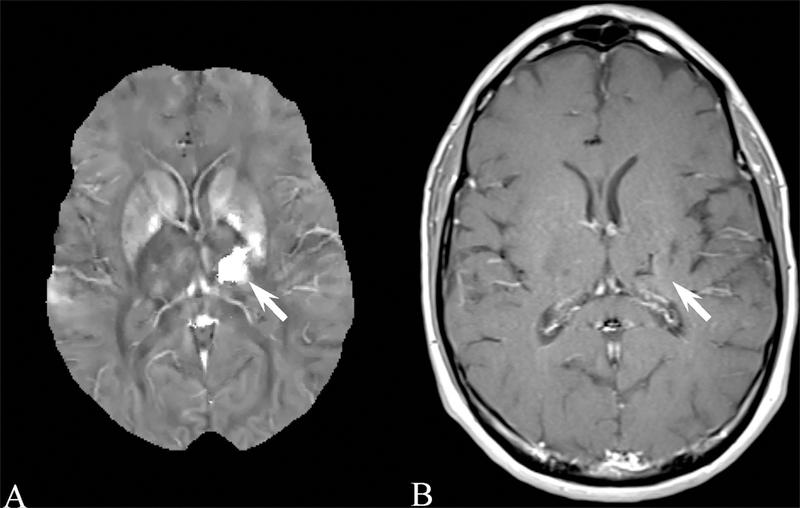
Figure 8.

A) Brain quantitative susceptibility map of a 49 year old male with intracranial hemorrhage (arrow). The large hyperintensity indicates the strong paramagnetism of the hemorrhage. B) The corresponding contrast enhanced longitudinal relaxation (T1) weighted image.
