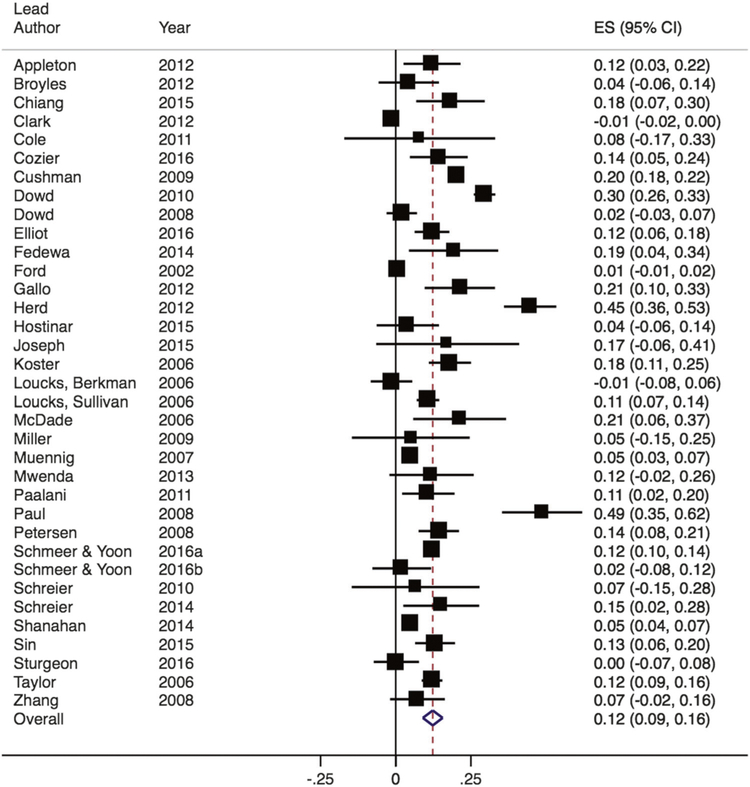
Fig. 2.
Forest plot of effect sizes from studies examining the association between SES and CRP. Box sizes are indicative of study weight, with box center positioned at the point estimate of the effect. Horizontal lines indicate 95% CIs. Dashed vertical line indicates the estimated meta-analytic effect

