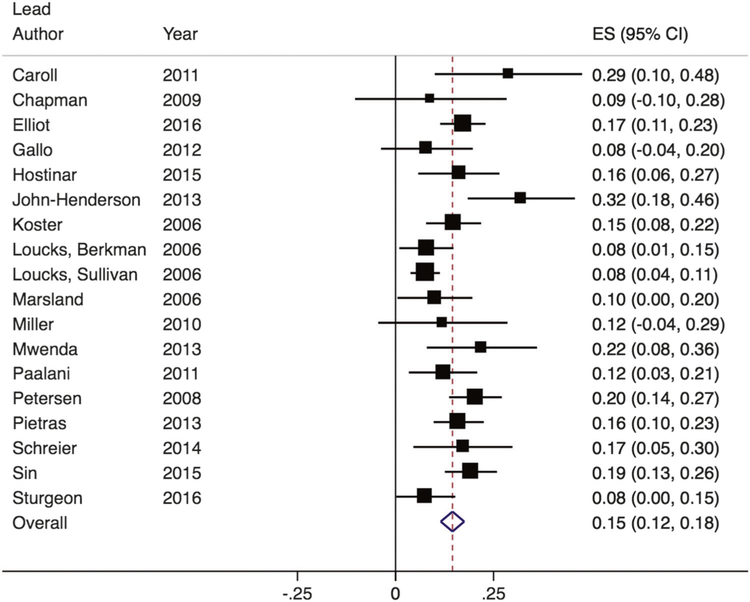
Fig. 3.
Forest plot of effect sizes from studies examining the association between SES and IL-6. Box sizes are indicative of study weight, with box center positioned at the point estimate of the effect. Horizontal lines indicate 95% CIs. Dashed vertical line indicates the estimated meta-analytic effect

