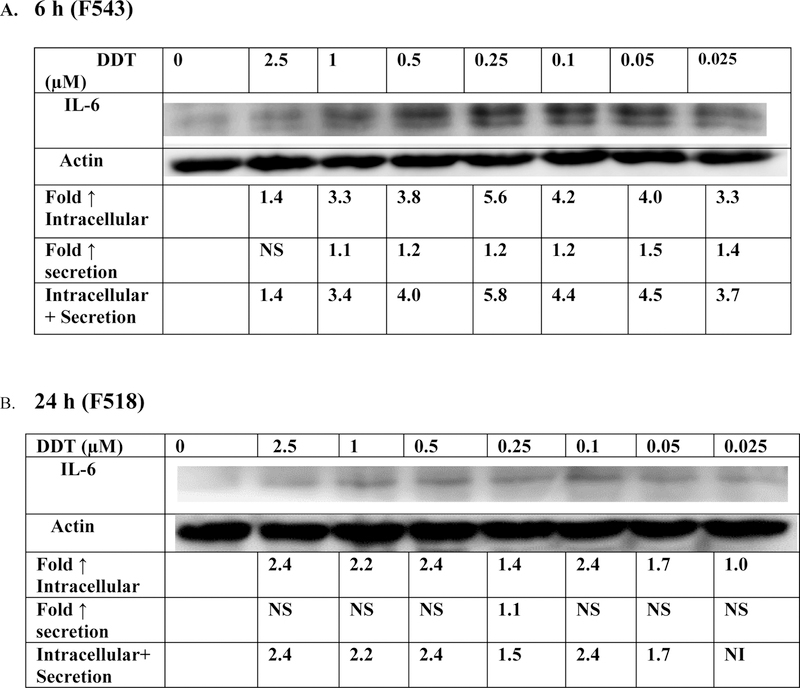
Figure 5. Effect exposures to DDT on synthesis of IL-6 in PBMCs.
Effects of exposures to 0–2.5 µM DDT on the production of IL-6 in PBMCs. A) 6 h exposure. The blot is from a representative experiment (F543) with accompanying secretion data. An increase in secretion or in intracellular level is a number greater than 1; a decrease in secretion or intracellular level is a number less than 1. The control is arbitrarily set at 1. A combined fold increase (secretion + intracellular) greater than 1 indicates an increase in production. Changes in fold production for 3 additional experiments are given in Table 4. B) 24 h exposure. The blot is from a representative experiment (F518) with accompanying secretion data. Changes in fold production for 3 additional experiments are given in Table 4.
NI indicates no significant increase in production (fold increase ≤1); NS indicates no significant change in secretion (p>0.05)

