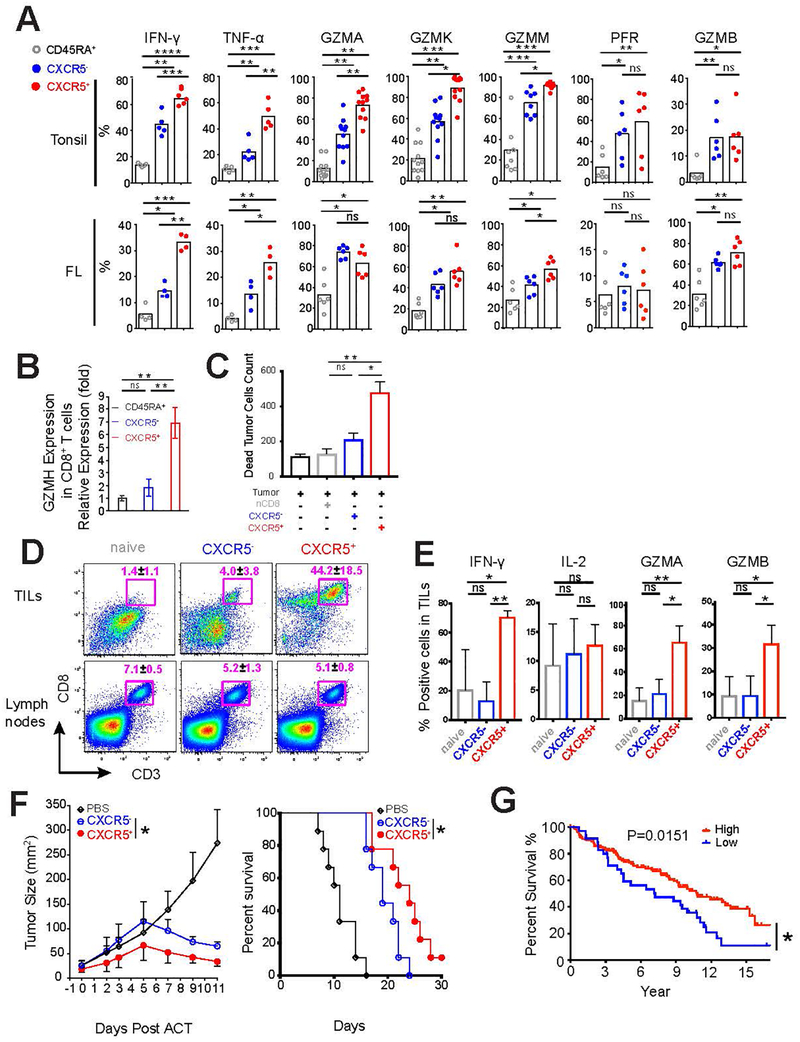
Figure 4.
Functional features of CXCR5+CD8+ T cells in human tonsil and follicular lymphoma samples. (a) Intracellular expression of cytokines, granzymes, and perforin were determined in the three CD8+ T cell subsets (CD45RA+CXCR5−CD8+, CD45RA−CXCR5−CD8+, and CD45RA−CXCR5+CD8+) isolated from human tonsils (n=5–11) and follicular lymphoma (n=4–6) after stimulation with PMA/Ionomycin as in figure 3 d. (b) Granzyme H expression in the three CD8+ T cell subsets of human tonsils was analyzed by qPCR. Results are representative of three independent experiments. (c-d) Purified CD45RA+CXCR5−CD8+ T cells from follicular lymphoma samples were activated as described in Figure 3 c and sorted based on CXCR5 expression. Sorted T cell subsets were then co-cultured with autologous tumor cells at the indicated effector : target (E:T) ratios as shown in Figure S3 a. The absolute number (left panel) and percentage (right panel) of CD107a/b+ subset in CXCR5−CD8+ and CXCR5+CD8+ T cells are shown (c). Absolute numbers of dead tumor cells were determined using counting beads, and values are shown for E:T ratio of 10:1 (d). Results are representative of 3 independent experiments (c-d). (e-g) C57BL/6 mice injected with EG7-OVA cells on day 8 were treated with the indicated CD8+ T cell subsets on day 7. The abundance of CD3+CD8+ T cells (e), their expression of IFN- γ, IL-2, granzyme A and B (f) in tumor (TILs) and tumor draining lymph nodes were analyzed. Tumor sizes (left) and survival (right) were monitored (g). Summary data from two independent experiments is shown. (h) Kaplan-Meier curves for overall survival in patients with follicular lymphoma with low (< 25 percentile) or high expression (≥ 25 percentile) of upregulated CXCR5+CD8+ T cell signature genes are shown. P value was calculated using log-rank test.

