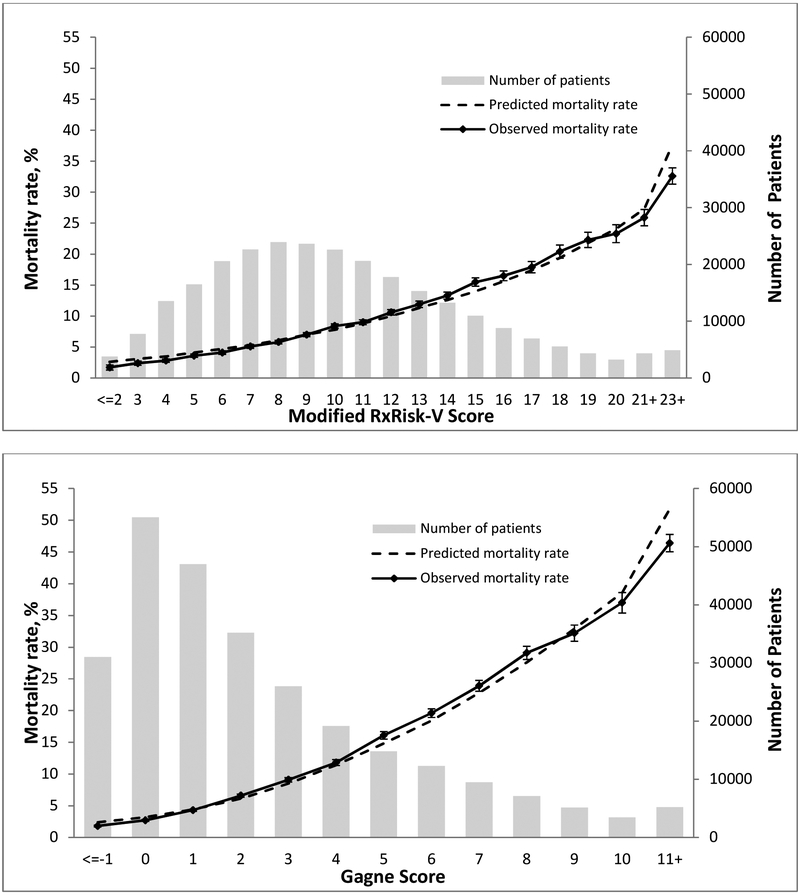
Figure 1: Calibration Curves of the Modified RxRisk-V and Gagne Indices.
For the RxRisk-VM model, the absolute difference between the observed and predicted probabilities are all < 1% except for two groups: 1) RxRisk-VM score=15, 1.5% difference, 2) RxRisk-VM Score >21, −3.4%. For the Gagne Model, the absolute difference between the observed and predicted probabilities are all smaller than 1.6% except −5.4% for Gagne Score ≥11

