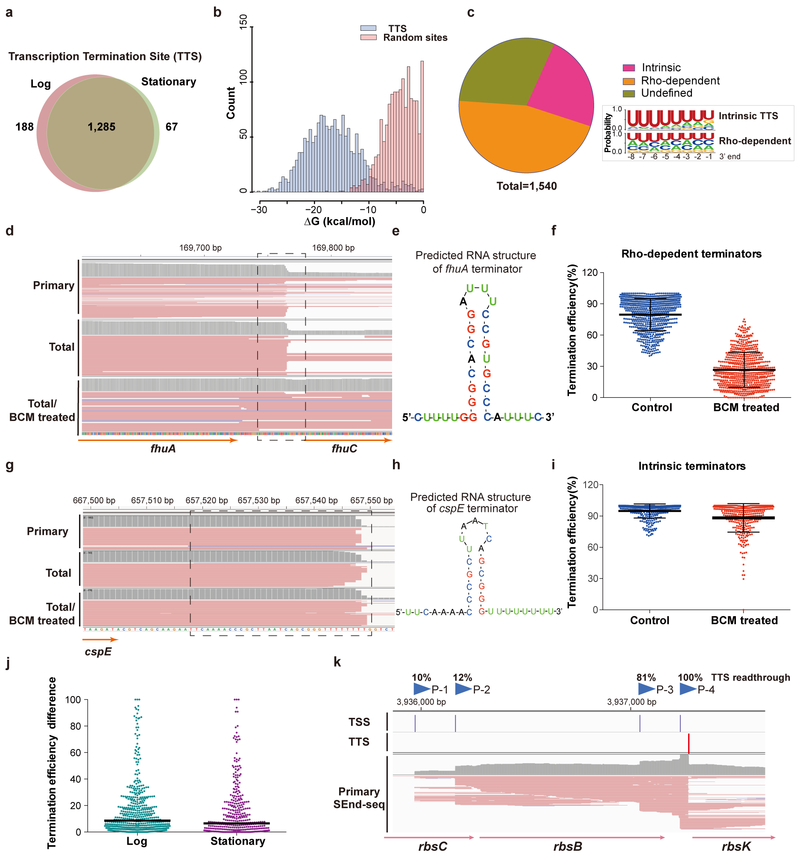
Fig. 3 |. Identification of transcription termination sites (TTS).
a, Venn diagram showing the number of identified TTS for log versus stationary phase E. coli cells. b, Distribution of the RNA folding energy for identified TTS sequences (blue bars) compared with that for sequences of identical length randomly selected from the E. coli genome (red bars). c, (left) Pie chart showing the fraction of intrinsic and Rho-dependent terminators identified by SEnd-seq. (right) Nucleotide profiles for the 3’-end sequences of intrinsic and Rho-dependent TTS. Data are representative of two independent experiments. d, SEnd-seq data track for an example Rho-dependent terminator located downstream of the fhuA gene. When treated with the Rho inhibitor bicyclomycin (BCM), the fraction of readthrough transcripts significantly increased. e, Predicted secondary structure of the fhuA terminator. f, Average termination efficiency of all identified Rho-dependent terminators without or with BCM treatment. n = 709 (number of terminators analyzed). Error bars denote s.d. Data are representative of two independent experiments. g, SEnd-seq data track for an example intrinsic terminator located downstream of the cspE gene. h, Predicted secondary structure of the cspE terminator. i, Average termination efficiency of all identified intrinsic terminators without or with BCM treatment. n = 357. Error bars denote s.d. Data are representative of two independent experiments. j, Scatter plot showing the span of termination efficiency for each TTS that is linked to multiple TSS. For example, a data point at 50% means that, for this TTS, the maximal termination efficiency and the minimal efficiency—depending on the choice of TSS—differ by 50%. n = 520 for the log-phase dataset and 395 for the stationary-phase dataset. The black bars indicate median values. k, An example SEnd-seq data track illustrating that the alternative usage of TSS can induce differential termination efficiencies at the same TTS. The fractions of readthrough transcripts initiated from any given TSS (P-1 to P-4) are indicated.

