Fig. 1.
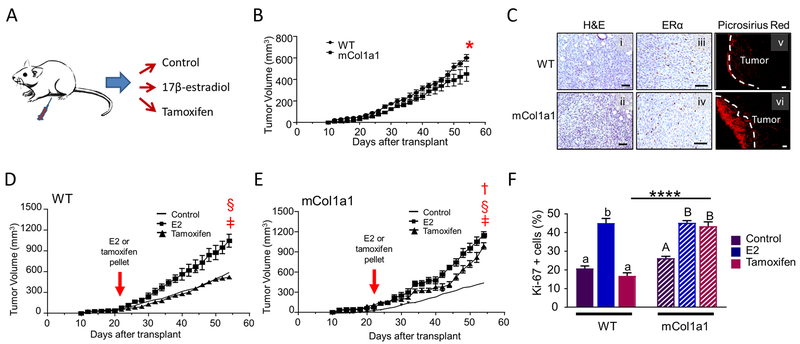
Primary tumors are estrogen responsive, and both E2 and tamoxifen increase tumor growth in mCol1a1 recipients. a Experimental design. TC11 cells were orthotopically transplanted into WT and mCol1a1 recipients. When tumors reached 150 mm3 (21 – 23 days post-transplantation), the estrogen environment was modulated by administration of E2 or tamoxifen, or no treatment, as described in the Materials and methods. Tumor volumes were measured three times per week, and tissues were collected when primary tumors reached end-stage. b Primary tumors grew faster in wildtype (WT) than in mCol1a1 recipients. (Mean ± SEM; n=12). Significant interaction with genotype, determined by repeated measures two-way ANOVA, *p = 0.03. c Collagen environment did not alter morphology (i, ii; hematoxylin and eosin, H&E), or ER expression assessed by immunohistochemistry (iii, iv). Picrosirius red staining (v-vi) demonstrated accumulated fibrillar collagen around boundaries of primary tumors in mCol1a1 recipients. Original magnifications, x200; scale bars, 50 μm. d, e Tumor growth curves show that 17β-estradiol (E2) increased tumor growth in both recipient genotypes (d,e) and tamoxifen increased tumor growth in the mCol1a1 females (e). Solid lines depict mean sizes of primary tumors in untreated animals from (b). (Mean ± SEM; n=10–14). (b,d,e), Significant differences in tumor volumes between genotypes and among treatment groups were determined by repeated measures two-way ANOVA. ǂ denotes a significant difference between control and E2, p < 0.0001; † denotes a significant difference between control and tamoxifen-treated animals, p <0.0001; § denotes a significant difference between E2- and tamoxifen-treated animals, p < 0.0001. f Rate of proliferation of tumor cells at the time of collection, assessed by nuclear Ki-67 staining. (Mean ± SEM; n= 5). Significant differences were determined by two-way ANOVA, followed by the Bonferroni post-test. Lower case letters denote significant differences with treatment in WT recipients, and uppercase letters denote significant differences with treatment in mCol1a1 recipients (p < 0.0001). **** denotes a significant difference between recipient genotypes administered the same treatment (p < 0.0001).

