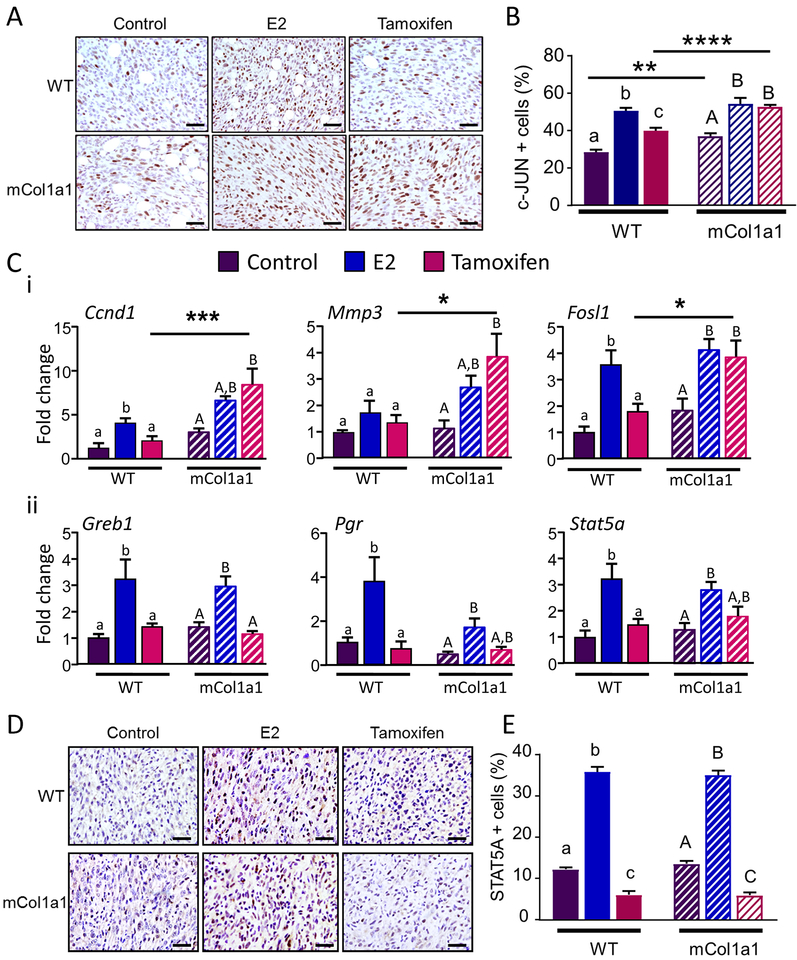
Fig. 4.
Collagen 1-rich environments activate AP-1. a Representative c-JUN immunohistochemistry in primary tumors in recipients of different genotypes and treatments. b Quantification of the proportion of tumor cells exhibiting nuclear c-JUN staining. c i Relative levels of transcripts for AP-1 regulated genes in primary tumors in recipients of different genotypes and treatments determined by RT-PCR, normalized to 18S RNA. ii Relative levels of transcripts for ERE-regulated genes in primary tumors in recipients of different genotypes and treatments determined by RT-PCR, normalized to 18S RNA. d Representative STAT5A immunohistochemistry in primary tumors in recipients of different genotypes and treatments. f Quantification of the proportion of tumor cells exhibiting nuclear STAT5A staining. a, d Original magnifications, x200; scale bars, 50 μm. b, c, e. Mean ± SEM; n=4–6. Significant differences with treatment were determined by one-way ANOVA, followed by the Bonferroni post-test. Lower case letters denote significant differences with treatment in WT recipients and uppercase letters denote significant differences in mCol1a1 recipients (p < 0.05). Significant differences between genotypes with the same treatment were determined by two-way ANOVA, followed by the Bonferroni post-test. * denotes significant differences between recipient genotypes (*p < 0.05, **p < 0.01, ***p < 0.001, ****p < 0.0001).

