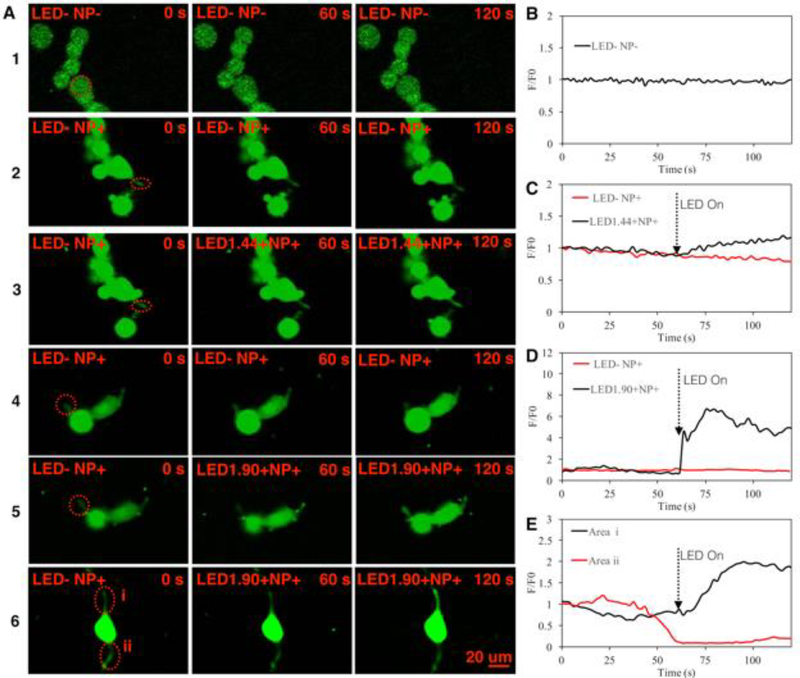
Figure 5.
Calcium influx induced by LEDs at the neurites. (A). The 1st row shows control group of cells without LEDs and NPs; the 2nd and 4th row shows groups of cells with NPs and without LED treatment. For the 3rd, 5th and 6th row, cells with NPs were irradiated by LED light at the intensity of 1.44, 1.09 and 1.90 mW/cm2 starting from t=60s to t=120s. (B). The normalized fluorescence intensity of circled area in the 1st row of (A) for the control group. (C) The normalized fluorescence intensity of circled area in the 2nd and 3rd row of (A) for the NP treated group without LED and LED intensity=1.44 mW/cm2, respectively. (D). The normalized fluorescence intensity of circled area in the 4th and 5th row of (A) for the NP treated group without LED and LED intensity=1.90 mW/cm2, respectively. (E). The normalized fluorescence intensity of circled area i and ii in the 6th row of (A) for LED intensity=1.90 mW/cm2.

