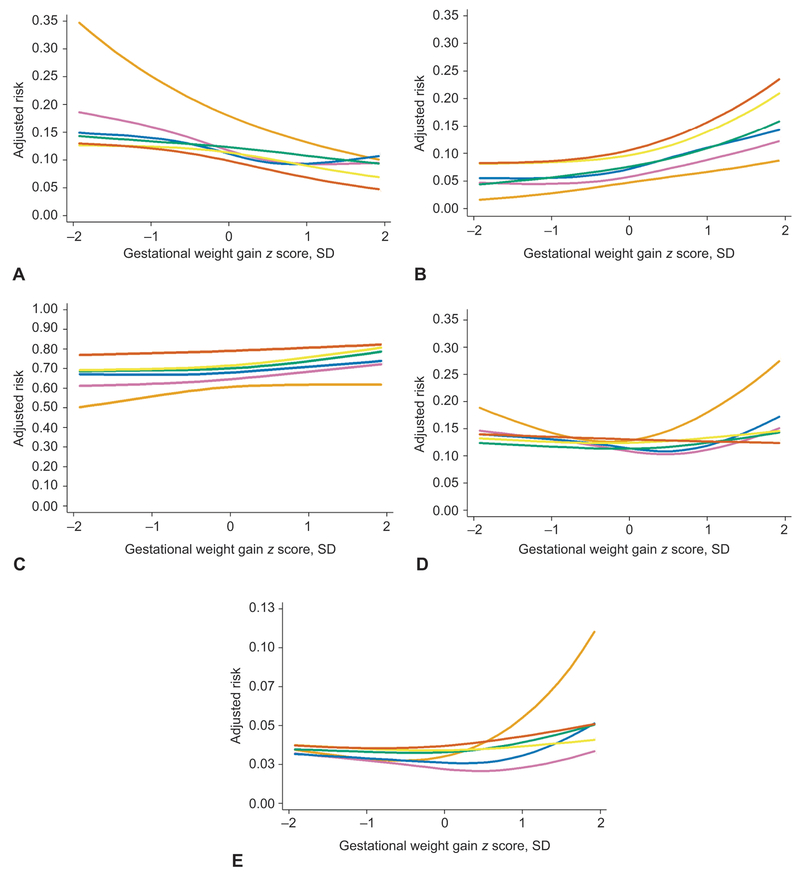
Figure 1.
Association between gestational weight gain z score and the adjusted predicted risks of five adverse perinatal outcomes, shown separately for women who are underweight (n=1,858, light orange lines), normal weight (n=26,011, purple lines), overweight (n=13,373, blue lines), grade 1 obese (n=7,153, green lines), grade 2 obese (n=3,684, yellow lines), or grade 3 obese (n=2,757, dark orange lines), Pennsylvania twin birth certificates, 2003–2013. The solid lines represent the point estimate. The 95% confidence bands have been removed for readability. Effect estimates that correspond to this figure appear in Table 4. Gestational weight gain z scores −2, −1, 0, 1, and 2 standard deviations correspond to the following total gestational weight gains at 37 weeks of gestation: 9.4, 14, 20, 27, and 37 kg for underweight and normal weight women; 5.5, 11, 18, 28, and 41 kg for overweight women; 0.9, 6.4, 14, 26, and 43 kg for women with grade 1, 2, or 3 obesity. Risks were set at the population average for maternal race or ethnicity, maternal education, maternal age, marital status, parity, insurance source, smoking during pregnancy, preexisting diabetes or hypertension, height, prepregnancy weight, infertility treatment, infant sex, neonatal care level of birth facility, year of birth, urban residence, and racial composition of neighborhood. Small for gestational age (A), large for gestational age (B), cesarean delivery (C), early preterm birth (<32 weeks of gestation) (D), and infant death (E).

