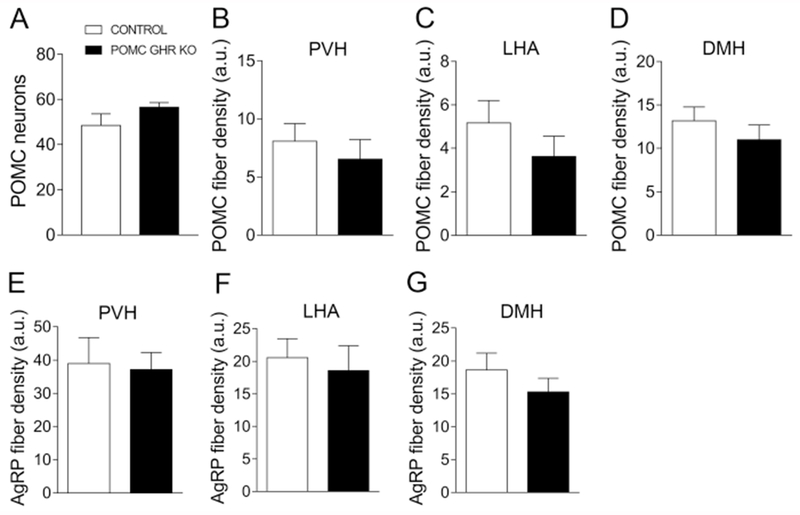
Fig. 2. Axonal projections of arcuate nucleus neurons.

A. Bar graph comparing the number of POMC positive cells in the arcuate nucleus of control (n = 3) and POMC GHR KO male mice (n = 6). B-D. Bar graphs comparing POMC fiber density in the PVH (B), LHA (C) and DMH (D) of control (n = 3) and POMC GHR KO male mice (n = 6). E-G. Bar graphs comparing AgRP fiber density in the PVH (E), LHA (F) and DMH (G) of control (n = 3) and POMC GHR KO male mice (n = 6). Comparisons between groups were performed using two-tailed Student’s t-test.
