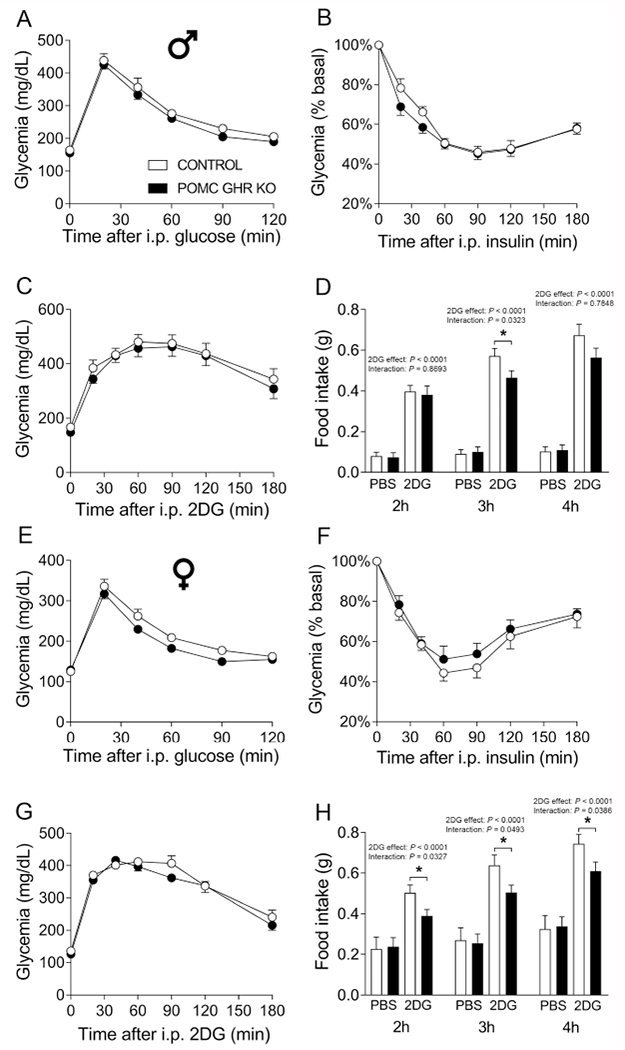
Fig. 5. Normal glucose homeostasis, but impaired 2DG-induced hyperphagia in POMC GHR KO mice.

A-C. Blood glucose levels during a glucose tolerance test (GTT, A), insulin tolerance test (ITT, B) and counter-regulatory response induced by 2-deoxy-D-glucose (2DG) infusion (C) in control (n = 16) and POMC GHR KO (n = 16) male mice. D. cumulative food intake 2, 3 and 4 hours after i.p. injection of PBS or 2DG in control (n = 16) and POMC GHR KO (n = 16) male mice. E-G. Blood glucose levels during a GTT (E), ITT (F) and counter-regulatory response induced by 2DG infusion (G) in control (n = 16) and POMC GHR KO (n = 16) female mice. H. cumulative food intake 2, 3 and 4 hours after i.p. injection of PBS or 2DG in control (n = 16) and POMC GHR KO (n = 16) female mice. The data were analyzed by repeated measures two-way ANOVA and the contrasts identified by Bonferroni’s multiple comparisons test. *, P < 0.05 (interaction between 2DG and genotype in each time point).
