
Fig. 9. Metabolic changes during food restriction in POMC STAT5 KO male mice.
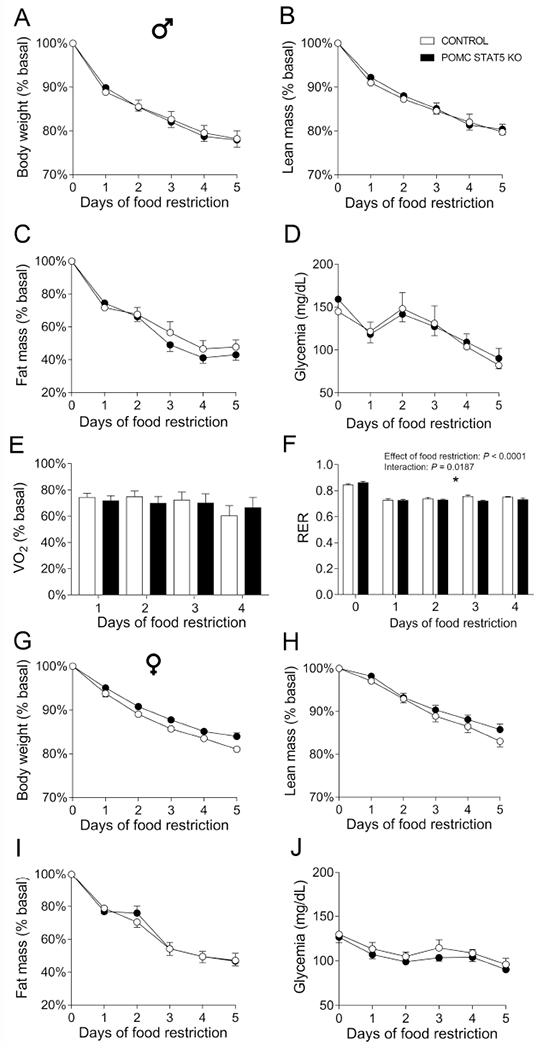
A-F. Changes in body weight (A), lean body mass (B), body fat mass (C), glycemia (D), oxygen consumption (VO2, E) and respiratory exchange ratio (RER, F) in control (n = 7) and POMC STAT5 KO (n = 12) male mice subjected to 5 days of 60% food restriction. G-J. Changes in body weight (A), lean body mass (B), body fat mass (C) and glycemia (D) in control (n = 10) and POMC STAT5 KO (n = 10) female mice subjected to 5 days of 60% food restriction. The data were analyzed by repeated measures two-way ANOVA. *, P < 0.05 (interaction between food restriction and STAT5 ablation).