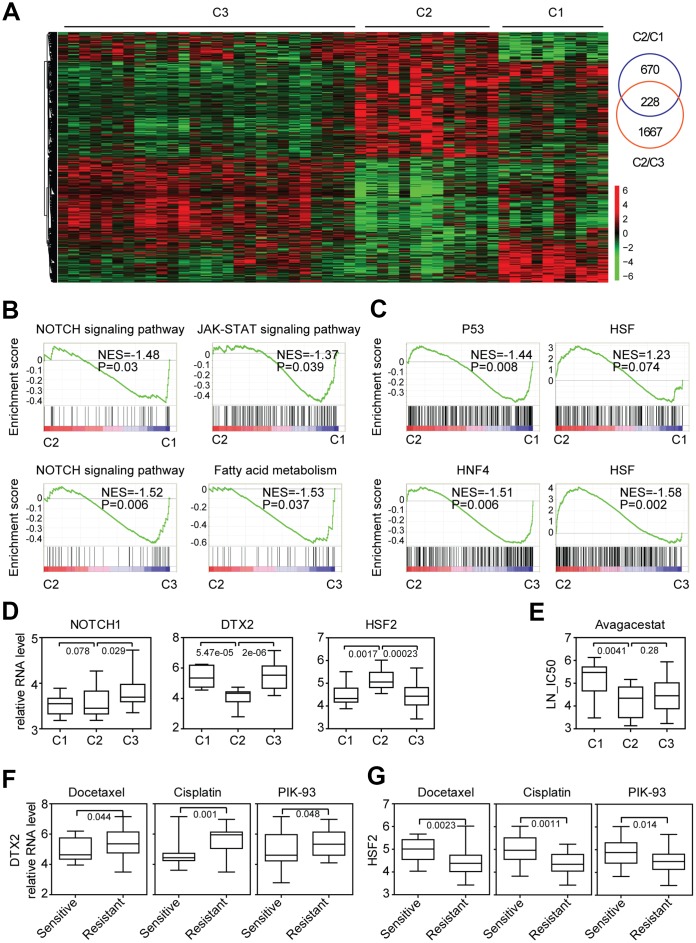
Figure 4.
Characteristics of gene expression and functional annotation of colon cancer sub-clusters suggest the different response to NOTCH inhibitor treatment. (A) Un-supervised clustering heatmap showed the genes specifically expressed in cluster2 colon cancer cells. (B) Enrichment plots showed the enriched signaling pathways in cluster2 colon cancer cells. Enrichment of NES and P values were shown. (C) Enrichment plots showed the enriched transcription factors in cluster2 colon cancer cells. (D) Box plots showed the NOTCH1, DTX2 and HSF2 expression in each sub-cluster of colon cancer cells. (E) Box plots showed the LN-IC50 of NOTCH signaling pathway inhibitor avagacestat in each sub-cluster of colon cancer cells. (F–G) Box plots showed the DTX2 (F) and HSF2 (G) expression in docetaxel, cisplatin, PIK-93 sensitive and resistant colon cancer cells.

